
Product development in 2026 still follows the 2020 playbook—compressed cycles, designed for data, sustainability embedded in the BOM, and supply chain risks designed out at the CAD stage—but every knob is turned tighter. The average cycle time for consumer hardware drops from 22 months in 2020 to 14 months in 2025. 53% of B2B buyers now request documented sustainability data during the RFQ phase. Warranty and repair right regulations in the EU, California, and increasingly in parts of Asia, are forcing many decisions that used to be "post-launch firefighting" into conceptual review. Here's an interpretation for 2026—adoption rates, investment ranges, and explicit trade-offs—to help you pick the "two or three things that really deserve investment" for your roadmap.
Where Product Development Budgets Are Moving
Global R&D spending in the manufacturing goods category surpassed USD 19 trillion in 2025 and is projected to approach USD 24 trillion by 2028. Within this total, the fastest-growing sub-sectors are integrated PLM and digital thread platforms (28% CAGR), in-product telemetry and post-launch analytics (31%), and sustainability compliance tools (34%).
| Sub-segment | 2025 Spending (USD 100M) | 2028 Projection (USD 100M) | CAGR | Tier-1 OEM Adoption Rate |
|---|---|---|---|---|
| CAD/CAE Seats | 380 | 440 | 4% | 96% |
| PLM & Digital Thread | 280 | 580 | 28% | 52% |
| In-product Telemetry & Analytics | 220 | 480 | 31% | 38% |
| Sustainability & Compliance Tools | 90 | 220 | 34% | 47% |
| DFM / Real-time Quoting Platforms | 60 | 140 | 32% | 41% |
| Generative & AI Design Co-Pilots | 110 | 280 | 36% | 29% |
Cycles Compressed Again—at an Organizational Cost

The median cycle time for consumer hardware moved from 22 months in 2020 to 14 months in 2025; for B2B industrial products, it moved from 34 months to 25 months. Compression isn't because CAD got faster. It's because leading teams committed to platform engineering—a shared hardware core with variations built on top—and because parallel prototyping finally became economically feasible with four to six concurrent versions instead of one at a time. The cost is organizational, not technical. Compressing cycles by 30% without adding headcount demands shorter handoffs, PLM truly reflecting current designs, and teams killing work that wouldn't pass stage-gate anyway, earlier. Teams that force this compression without doing this work won't ship faster; they'll ship a broken product four months earlier than the old schedule.
Signals from the Field
An appliance brand cuts cycle time from 18 to 11 months
A mid-range kitchen appliance manufacturer ran an 18-month cycle in 2022. By 2025, they had continuously shipped three products on an 11-month cycle, without expanding the engineering team. The unlock wasn't agile theater; it was a platform architecture—shared motor control board and thermal core—plus a commitment to run three industrial design variants in parallel using MJF in weeks 4, 8, and 12, instead of sequentially. The truly important action: they stopped asking "which version is best" in week 6, and started asking "which two can be cut with the least regret" from week 10 onwards. Parallel prototyping is only useful if the team actually cuts. The additional mold cost for parallel versions averaged USD 38,000; the saved cycle time translated to approximately USD 4.2 million in accelerated revenue per product.
A medical device manufacturer integrates field telemetry into its third version
A connected infusion pump shipped with basic error logging in 2022. The team added a formal telemetry pipeline in 2023, ran it throughout 2024, and by the time the third version entered production in 2025, they had data from 48,000 units: which alarm codes triggered under which hospital workflows, which components failed within what temperature ranges, and which UI paths were associated with customer service calls. Version 3 simplified the UI for four processes, changed the specification of one capacitor, and saw a 37% drop in warranty claims in the first quarter.
A B2B industrial supplier eliminates single-source risk at the CAD stage
A hydraulic supplier with a 2,400-line BOM audited its catalog in 2024 and found 180 single-source components with lead times exceeding 14 weeks. Within 11 months, they redesigned 64 assemblies to accept alternative seals, fasteners, and castings without functional changes. The project cost USD 1.4 million. The next disruption—a resin shortage in Q1 2025—would have caused approximately USD 6 million in delivery losses; it actually cost less than USD 400,000 because alternative sources were already designed into CAD.
Customer Expectations Keep Rising

What was a high-end feature in 2020 becomes standard in 2026. Wireless charging, voice control, a decent companion app, OTA firmware updates, and subscription tiers—products shipped without these in the consumer category will lose shelf space within six quarters. The deeper implication: products increasingly compete on "integration" rather than individual specifications. Refrigerators are evaluated by "how cleanly they join the customer's existing smart home network," no longer just by cubic feet.
Data-Driven Design Is Finally an Operating Discipline
38% of Tier-1 OEMs now operate a closed loop from in-product telemetry to the next design cycle; another 31% are in pilot stages. Teams that truly make this work treat it as an organizational problem, not a data problem: someone is responsible for "weekly interpretations," there's a quarterly backlog "written based on findings," and the next version includes at least three changes justified by "field data." Teams without this accountability mechanism will collect a lot of data that's never used.
Sustainability Enters the RFQ
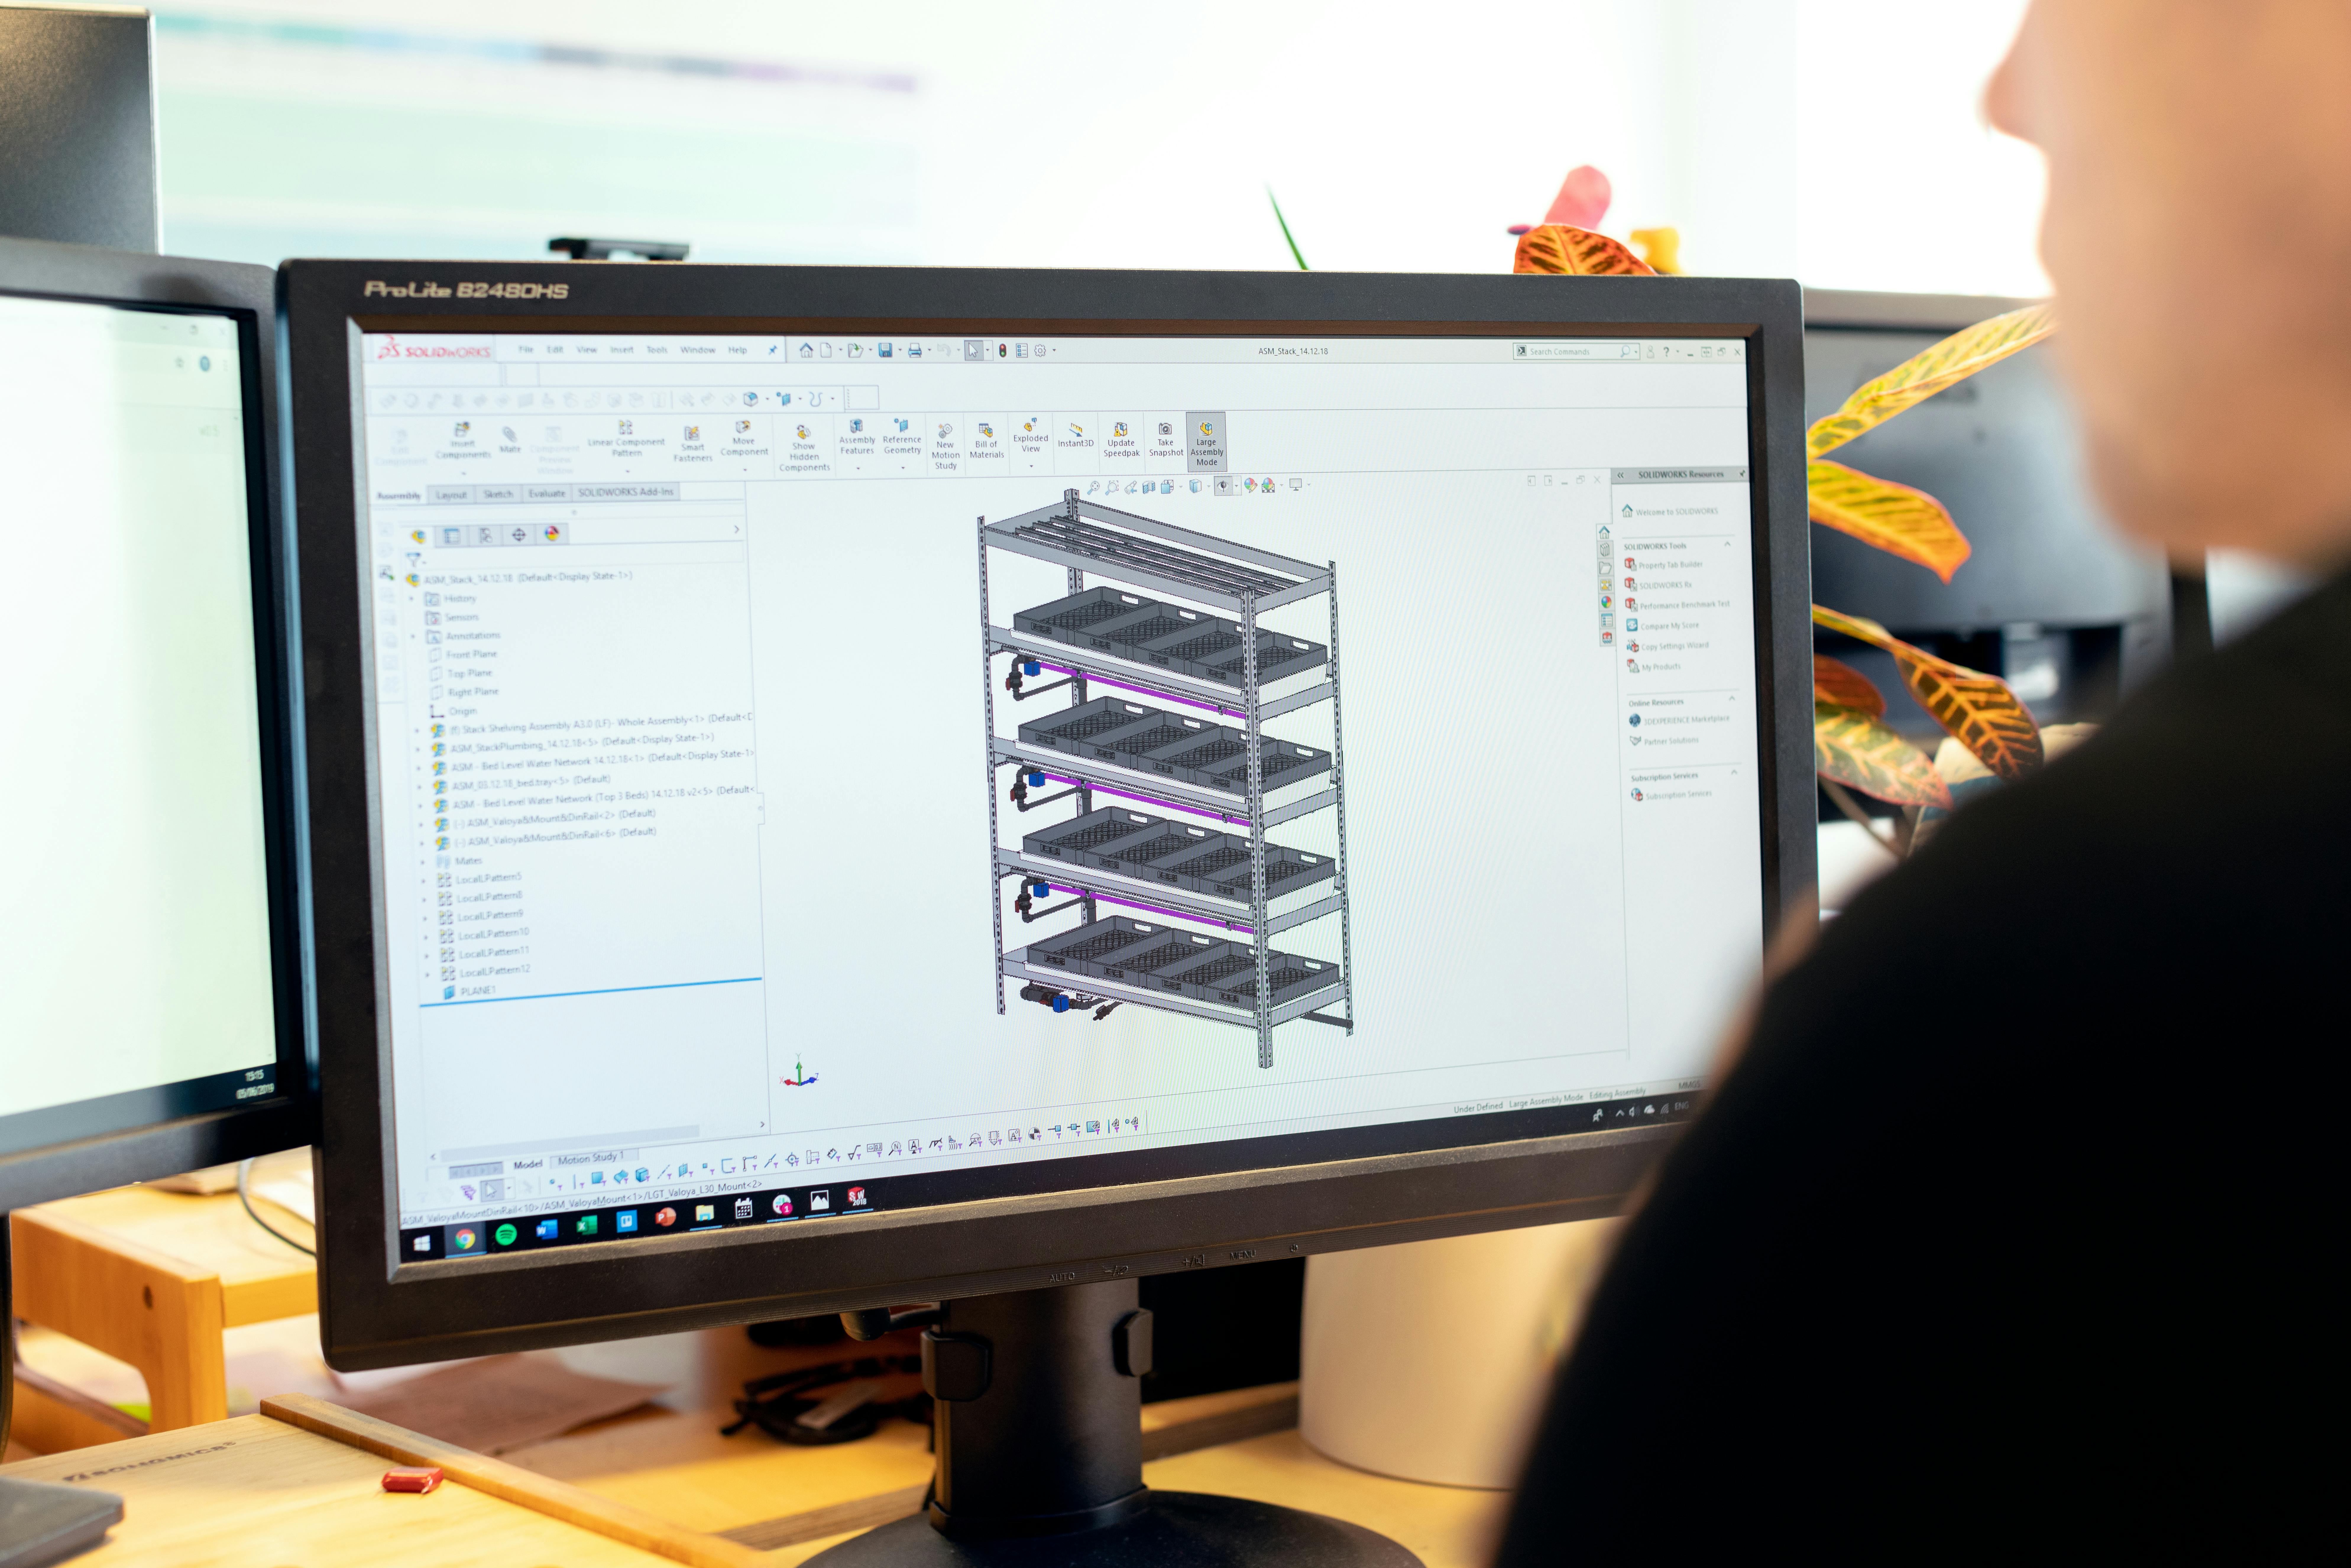
In many B2B categories, sustainability is no longer a differentiator but a qualifying criterion. In 2026, 53% of B2B buyers require documented CO2, recycled content, or end-of-life plans at the RFQ stage; in 2022, this figure was 22%. Extended Producer Responsibility regulations push decisions upstream: modular architectures, standardized fasteners, and spare part availability are now design requirements, not post-launch policies.
| Leverage | Typical Cost Impact | Cycle Time Impact | Buyer Qualification Value |
|---|---|---|---|
| 30% PCR resin for housing | +3 to +8% | +2 to +4 weeks validation | Pass 53% B2B RFQ |
| Standardized fastener architecture | -1 to +2% | Neutral | Complies with repair regulations |
| Designed for disassembly | +1 to +3% | +1 to +2 weeks | EPR compliance |
| Topology optimized lightweighting | Neutral to +4% | +3 to +6 weeks | CO2 reporting |
| Documented spare parts plan | Negligible | Neutral | Mandatory for EU buyers |
| Bio-resin substitution | +6 to +12% | +4 to +8 weeks validation | Retailer sustainability threshold |
Supply Chain Risk Is Now a CAD Stage Problem
The cheapest place to remove single-source risk is in CAD, not in procurement. In 2026, every design review should include a column for supply risk: identifying single-source components, flagging outlier lead times, and marking alternative components. The hydraulic supplier mentioned earlier avoided about USD 5.6 million in disruption costs with a USD 1.4 million redesign investment—a 4x return; this would have been zero if the audit happened post-launch.
A Two-Year Roadmap for Modern Product Development
| Timeline | Action | Typical Investment | Expected Return |
|---|---|---|---|
| 0–6 Months | Audit BOM for single-source risk | USD 60k–150k | 3–5x disruption cost avoidance |
| 0–6 Months | Add telemetry to Nth version product | USD 100k–250k | Accumulate field data for N+1 version |
| 6–12 Months | New product families adopt platform architecture | USD 400k–1.2M | 30–40% variant cycle compression |
| 6–12 Months | Add sustainability gate to concept review | USD 30k–80k (tools) | Pass 50%+ B2B RFQs |
| 12–18 Months | Run 3-variant parallel prototyping on flagship product | Additional molds USD 120k–350k | Save 2–4 months in cycle time |
| 12–24 Months | Close the loop between PLM and telemetry | USD 300k–900k | Data-driven backlog |
| 18–24 Months | Implement generative design co-pilot on a main component | USD 100k–250k | Reduce BOM line items |
Do's and Don'ts of Modern Product Development Processes
| Do | Avoid |
|---|---|
| Pick 2–3 trends and commit fully | Try to do all six in one fiscal year |
| Add a supply risk column to every design review | Leave single-source auditing to procurement |
| Install sensors on version N to get data for N+1 | Add telemetry only after feature freeze |
| Place sustainability at concept review | Force-fit PCR 8 weeks before mass production |
| Run parallel variants, and commit to cutting | Run parallel variants, but cut none |
| Do platform engineering first, then compress cycles | Force cycle compression on a monolithic architecture |
Common Mistakes in 2026 Product Development Planning
| Mistake | Why It Fails | How to Avoid |
|---|---|---|
| Forcing cycle compression without platform architecture | Same work, shorter time, worse output | Platform first, then compress |
| Telemetry without a responsible interpreter | Data accumulation, zero decisions | Assign a weekly interpretation owner |
| Sustainability as a last-minute replacement | Scrap, warping, certification delays | Set a gate at concept review |
| Post-launch single-source audit | Compounded disruption costs | Add a column to every design review |
| Parallel variants without cut points | Team budget exhausted | Set a clear cut-off meeting for week 10 |
| Buying CAD seats instead of integration | Seats are already there, value is in the thread | Invest in PLM and DFM integration |
Eight Strategic Actions for This Year
- This quarter, add a supply risk column to every design review and use it to audit the top 200 BOM lines.
- Add telemetry to currently shipping products to gather field data for the next version, rather than relying on opinions.
- Develop a platform architecture for your next two product families, then consider compressing cycle time.
- Implement sustainability gates (PCR, disassembly, spare parts plan) at every concept review, instead of addressing them post-launch.
- Invest in parallel prototyping for flagship products, and pre-commit to a cut decision meeting in week 10.
- Assign a named individual to interpret telemetry data weekly and generate design change orders from it.
- Stop buying CAD seats as a growth strategy; invest the same amount in integrating PLM with telemetry.
- Maintain documented secondary sources for every component with a lead time exceeding 12 weeks.
Design Takeaways
Product development in 2026 isn't a new playbook; it's the same playbook executed under greater pressure. The winning teams aren't those chasing every trend—they're the ones who pick two or three, invest until they're "more than just demos," and then instrument them so the next cycle starts with data (not opinions). Everything else is activity without progress.


0 comments