
A mid-sized orthopedic supplier we consulted at the beginning of 2023, based on the 2021 forecast of "40% annual growth in titanium implant printing," invested USD 2.4 million to build a second metal binder jetting production line. By Q3 2023, the actual growth was closer to 17%, and the production line ran at only 38% utilization for six months, yet the capital expenditure clock kept ticking. The problem wasn't the technology, but the curve. If they had treated the 2021 forecast as the ceiling of hype and planned capacity based on actual 2023 values, they would have bought only one machine instead of three, saving USD 1.6 million that could have been used for material certification. This is what interpreting the market in 2023 should really have been about. The point isn't to celebrate that the curve has finally slowed down—it's to identify which segments are still compounding, which have plateaued, and to align every capital expenditure with your actual sales segments, not the overall industry average.
What the 2023 Numbers Actually Said
Global additive manufacturing revenue in 2023 ended at approximately USD 20 billion, with an annual increase of about 11%—the slowest year in the past five, and the first full year with only double-digit growth. Contract manufacturers consolidated, hardware manufacturers laid off staff, and the stock prices of two pure additive SPAC-listed companies fell below their 2021 acquisition prices. Amid the slowdown, growth in mass production end-use applications outpaced overall growth, while pure prototyping volume remained flat.

Segment Growth Gaps Measured in Multiples
Overall growth masked the segment stories. The gap between the fastest and slowest applications in 2023 was larger than the overall growth itself—which is why general industry reports repeatedly misled capital expenditure decisions back then. The table below lists the compounding growth segments and the stagnant segments.
| Segment | 2023 YOY Growth | Driving Factors | 2026 Outlook |
|---|---|---|---|
| Metal AM Production Parts | 22–26% | Aerospace + Medical Certification Pipeline | Steady 18–22% |
| Dental Aligners + Crowns | 24–30% | Clinical Scaling, DTC Orthodontics | Slowdown to 15–18% |
| Factory Tools & Fixtures | 14–18% | Lead Time Pressure, Reshoring | Steady 12–15% |
| General Prototype Volume | 0–3% | Saturation, Price-driven | Flat to Slight Decline |
| Desktop Consumer FDM | -6 to -10% | Hardware Commoditization | Continued Shrinkage |
| Construction AM | 5–8% | Demonstration Phase, Regulatory Constraints | Gradual Increase |
Industry Adoption at Three Speeds
2023 was the year when the adoption curve clearly split into three groups: leaders, followers, and stagnators. Medical, aerospace, and some consumer verticals surged ahead; automotive and construction remained in the demonstration phase. This divergence is important because it tells you whose purchase orders will be real in 2026 and who is still in the piloting stage.
| Industry | 2023 Stance | Typical AM Spending | Reasons for Unlocking |
|---|---|---|---|
| Medical + Dental | Leading | USD 3–8M per mid-sized supplier | Patient-specific insurance reimbursement codes |
| Aerospace | Leading | USD 10M+ per OEM project | Part integration validated on flight |
| Performance Consumer Goods (Eyewear, Bicycles, Footwear) | Leading | USD 2–6M per brand | Lattice IP + high-margin customization |
| Industrial Tools & Fixtures | Following | USD 0.5–2M per factory | Downtime cost waiting for steel molds |
| Automotive Mass Market | Stagnant | Piloting only | Unit cost still 3–8x that of injection molding |
| Construction | Stagnant | Piloting only | Engineering permits and union rules not in place |
Material Expansion Faster Than Hardware
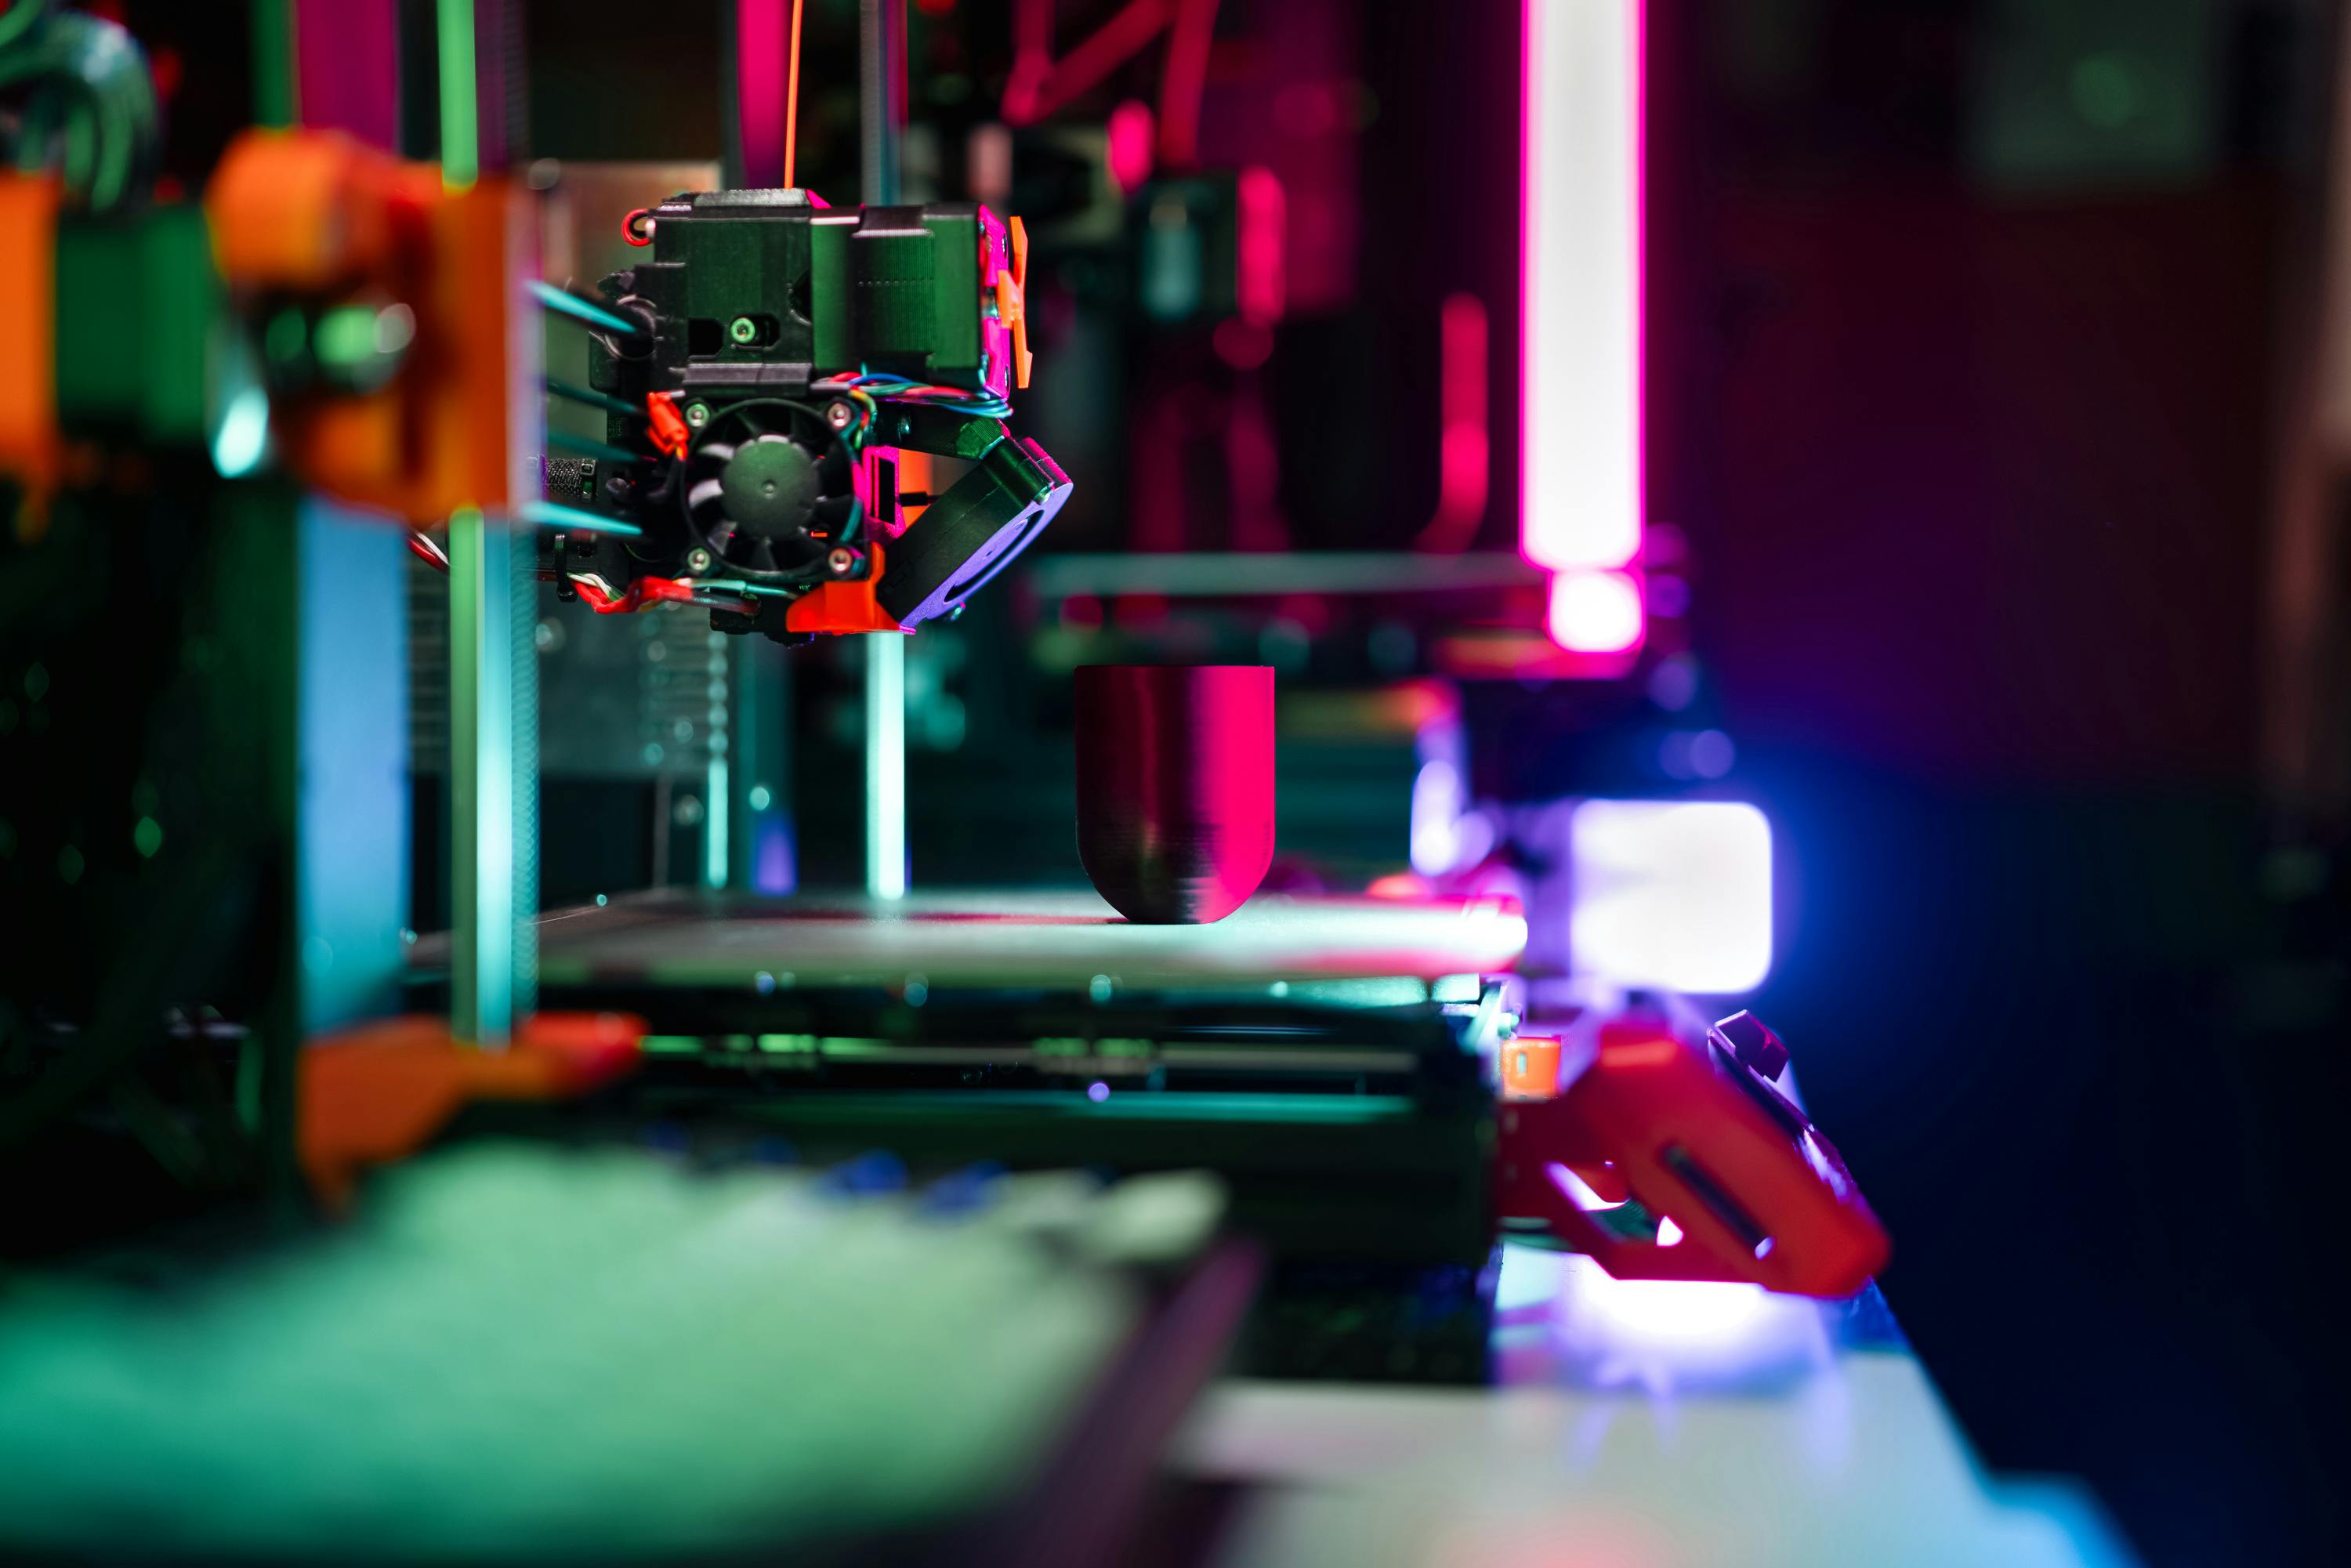
In 2023, the material story outperformed the hardware story in terms of revenue. High-performance polymers moved from "certified" to "production benchmark," multi-material resins allowed Carbon and Stratasys to achieve single-print assembly, and ceramics began shipping for semiconductor machine chambers. Each newly certified material unlocked a new list of addressable parts, independent of new printers.
| Material Category | 2023 Milestone Examples | End Use | Price Trend |
|---|---|---|---|
| PEEK / PEKK (FDM) | Achieved production certification on Stratasys F900, INTAMSYS | Aerospace brackets, spinal implants | Down 8–12% |
| Multi-material DLS Resins | One-print encapsulation completed | Sneaker midsoles | Flat |
| Engineering Ceramics | Semiconductor machine parts | Plasma chamber inserts | Down 5% |
| Ti-6Al-4V Powder | Aerospace + Medical Grade | Acetabular cups, engine brackets | Down 10–15% |
| Copper (Green Laser) | Heat exchanger feasibility | EV inverter cold plates | Down 6% |
| Biomass PLA+ | Consumer + Packaging | Short-run packaging | Flat |
Three Projects That Clarify the 2023 Story
Aerospace Project Printing 12,000 Titanium Brackets in One Year
A Tier-1 aerospace supplier shipped 12,000 laser powder bed fusion titanium brackets for a new narrow-body aircraft project by the end of 2023, replacing an assembly of 47 machined parts with rivets. The unit cost was USD 340, compared to USD 620 for the traditional assembly, while also reducing weight by 31%. This project recovered the USD 14 million production line investment in 22 months, faster than the 36 months estimated in the 2021 business case. What made this bracket work was not the printer, but integration. The original 47-part assembly had 94 fastener holes, each a inspection point and a fatigue initiation point. The printed part had only 4. Certification cost USD 2.1 million for test specimens and non-destructive inspection development, but once approved, the next three derivative brackets were free to use. The real signal: the unit economics of aerospace AM today depend on "how many derivative part numbers a certification package can cover." Projects covering four or more parts win on landed cost over traditional machining; projects certifying only one bracket at a time lose.
A Dental Lab Increased Aligner Production from 800 to 4,200 Sets Per Week
A Taipei dental lab increased production from 800 dental arches per week in January 2023 to 4,200 per week in December, by adding three DLP printers (USD 85,000 each) and replacing manual trimming with laser trimming. Revenue grew 4.9 times, while labor grew only 1.6 times. The bottleneck was never the printer, but the software for scanning and nesting—automatically nesting dental arches onto the build plate.
EV Inverter Cold Plates Replacing Brazed Assemblies
A European Tier-1 shipped 60,000 copper cold plates from its green laser LPBF production line in 2023, replacing original six-part brazed assemblies—which had a 4% leakage rate under thermal cycling. The printed part cost USD 48, 23% higher than the brazed USD 39, but the scrap rate dropped from 4% to 0.3%, making the landed cost break even at 38,000 units. Beyond this point, printing wins.
Unit Cost Reduction Is a Mechanical Reason, Not a Material Reason
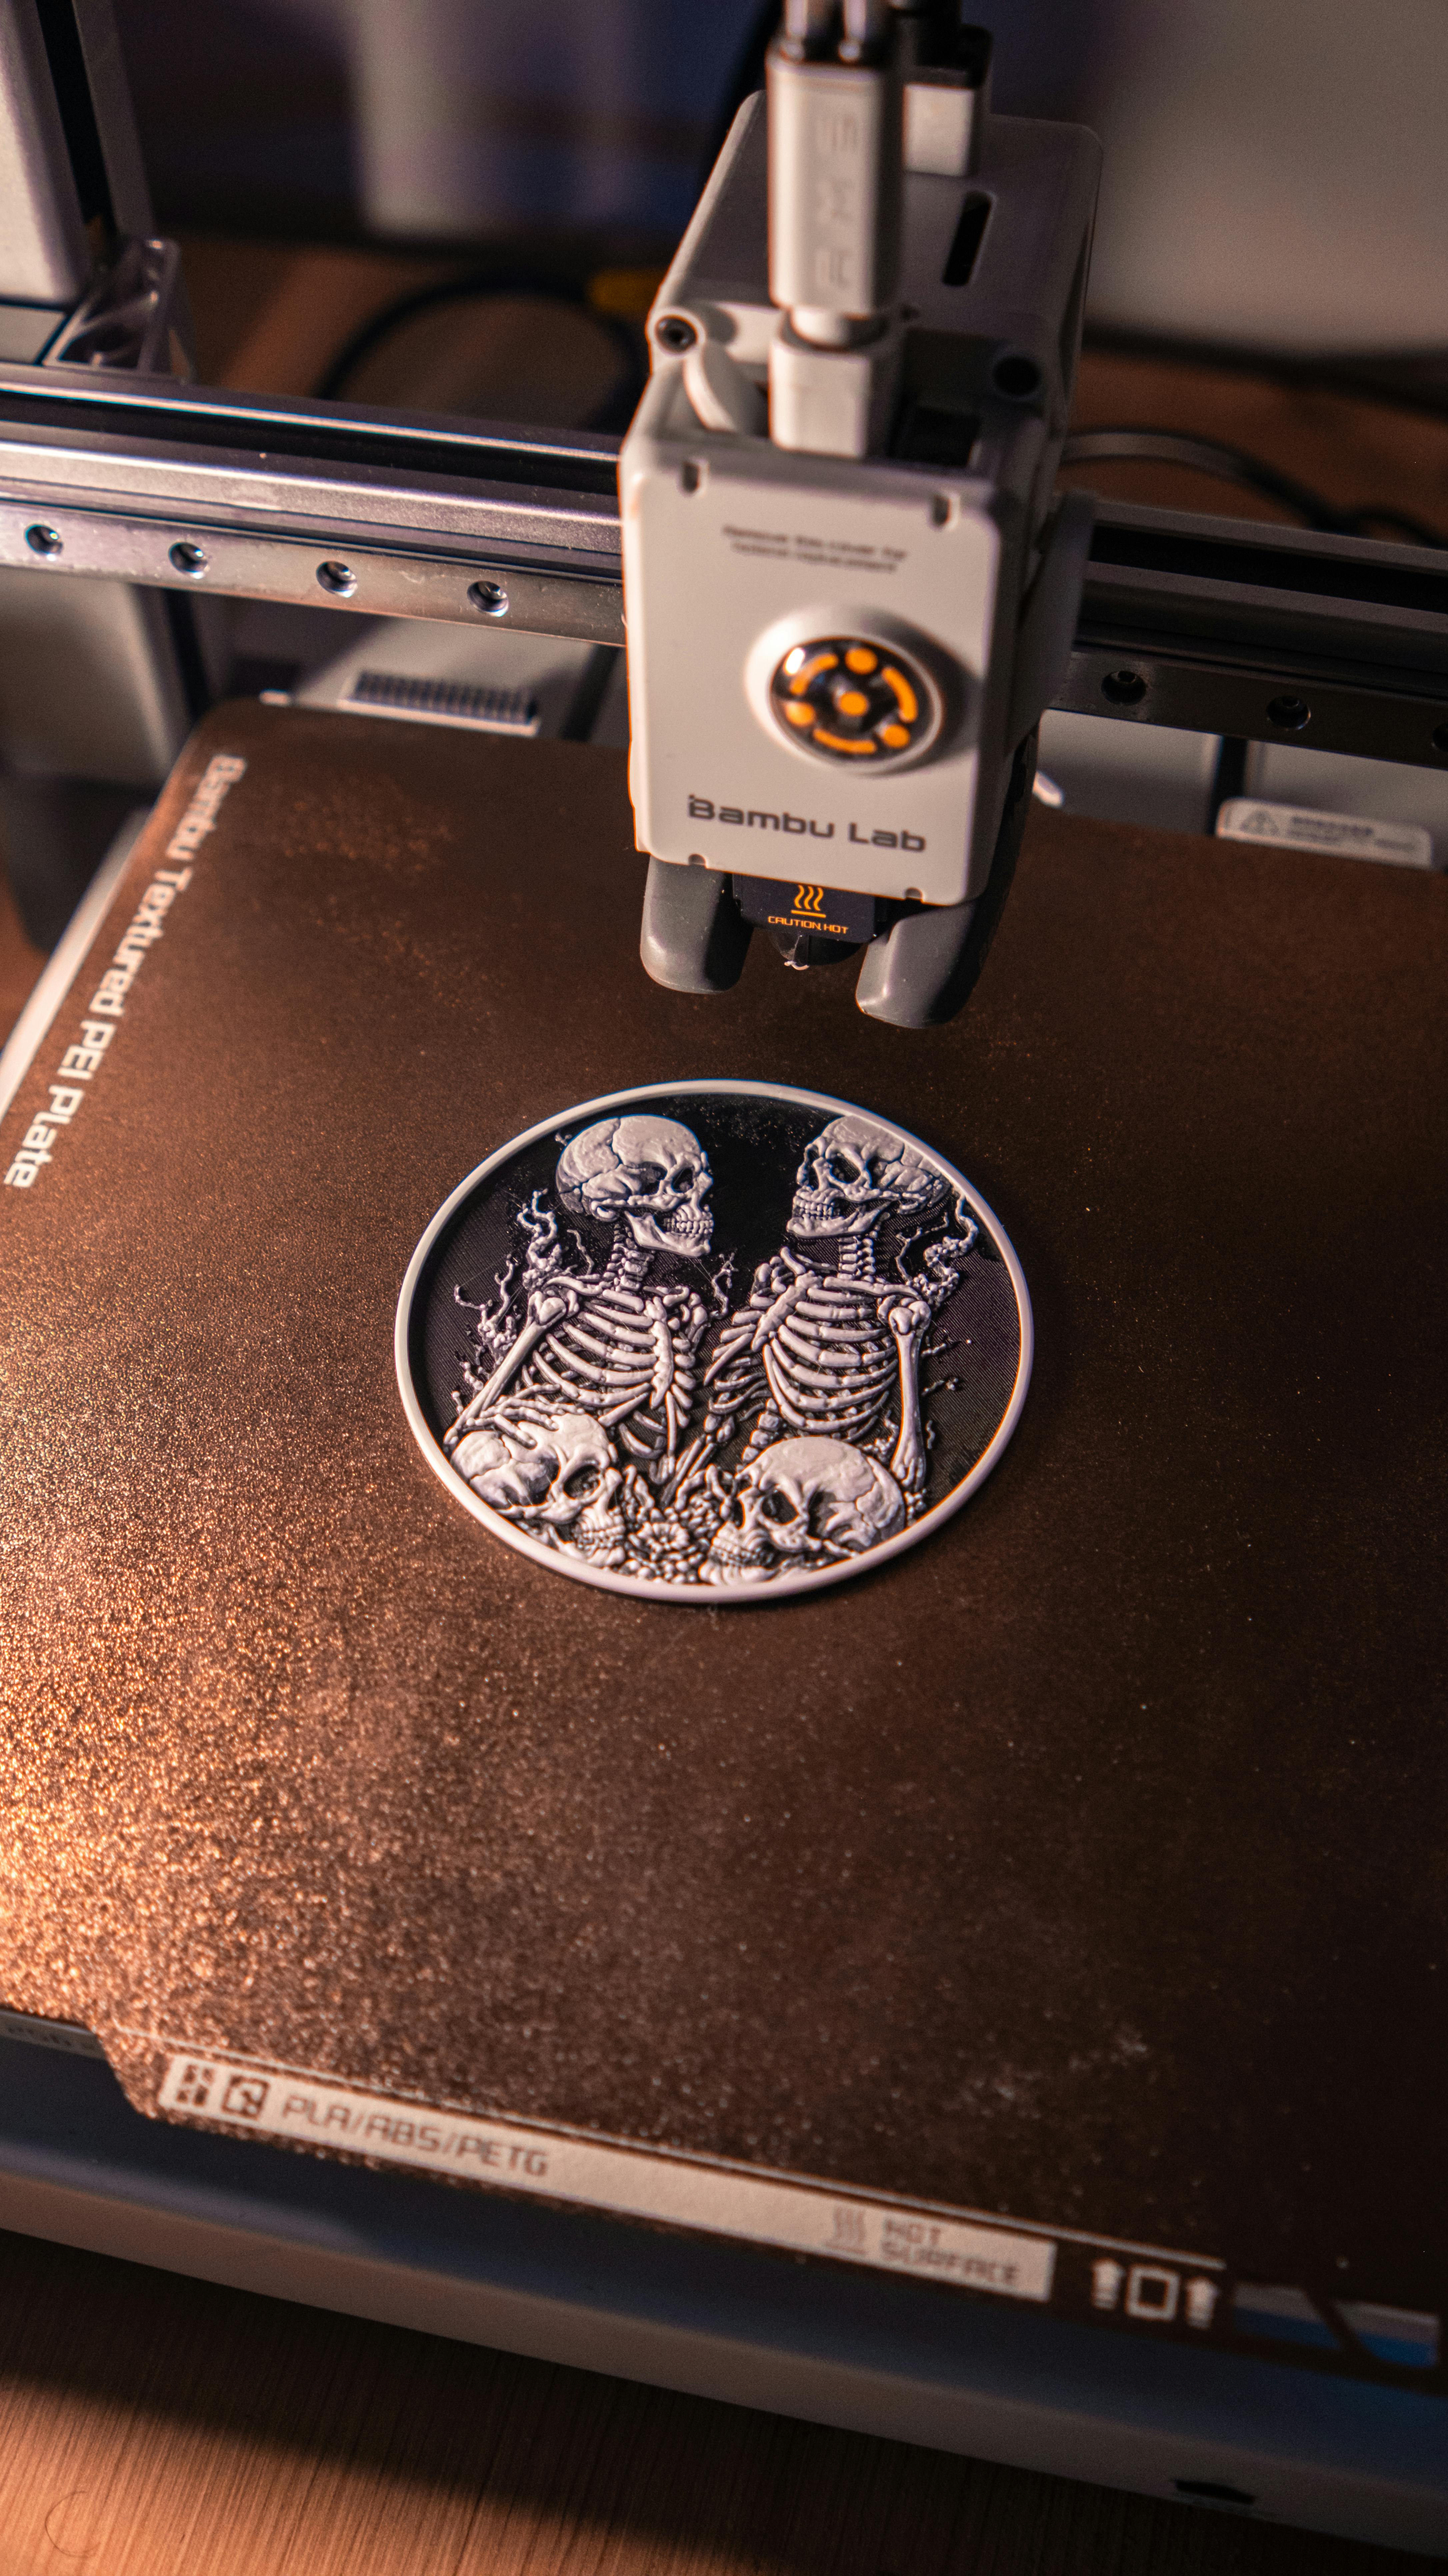
In 2023, the cheapest thing was not powder, but build plate density and the yield of "first-time-right." Contract manufacturers saw an average unit cost reduction of 9%, but powder prices only decreased by 3%. The remaining 6% came from higher nesting efficiency, shorter powder recoating times on new machines, and lower scrap rates due to mature process monitoring. Teams that only focused on pressing powder prices missed the bigger leverage.
| Cost Leverage | 2023 Contribution | 2026 Potential Reduction | Leverage Point |
|---|---|---|---|
| Powder Price | 3% | 3–5% | Diversified purchasing contracts |
| Build Plate Density | 4% | 6–8% | Nesting software, orientation |
| Powder Recoating + Laser Duty Cycle | 2% | 3–5% | New machines, multi-laser |
| Scrap Reduction | 2% | 3–4% | In-situ monitoring, closed-loop |
| Post-processing | 1% | 4–6% | Automated support removal |
| Inspection | 0.5% | 2–3% | CT + AI flag routing |
2023 Risk-Opportunity Landscape
| Area | Risk of Waiting | Opportunity of Acting |
|---|---|---|
| Certification Package | Competitor submits first, locks in projects | Define specifications, earn 4–6 derivative parts |
| Contract Manufacturing Agreement | Consolidation drives prices up 8–12% | Lock in multi-year contracts at 2023 prices |
| Production-grade Polymers | Existing materials get designed in first | Replace aluminum machining, 35% weight reduction |
| Recycled Metal Powder | Cost floor | Closed-loop argon recovery reduces by 6–9% |
| Workforce | AM operators scarce by 2025 | Hire certified, 20% cheaper in 2023–24 |
| Software | PLM drift makes traceability difficult | Integrate early, save audit quarters |
2023 Forecast Timeline
- Within 12 months, contract manufacturer consolidation will become apparent, 2–3 significant mergers will reset prices—lock in contracts now
- Within 24 months, PEEK and engineering ceramics will reach production benchmarks, each production line should certify one alternative material
- Within 36 months, EV cold plates and aerospace bracket derivatives will drive growth, sufficient to conditionally add a second production line
- Within 48–60 months, construction AM will obtain its first real permits, automotive mass market will re-evaluate selective adoption—observe, reset baseline, do not buy prematurely
Dos and Don'ts for Capital Expenditure in the 2023 Period
| Do | Don't |
|---|---|
| Base capital expenditure on actual 2023 growth in your segment, not the overall 11% | Report the overall average to your CFO |
| Lock in contract manufacturing agreements before 2024 consolidation | Assume 2023 spot prices will hold until 2025 |
| Certify one alternative material for each production line | Certify nothing and wait for perfect specifications |
| Spread certification across 4+ derivative part numbers | Pay full certification fees for a single bracket |
| Hire AM operators when labor is soft in 2023 | Wait until 2025 and pay 20% more |
| Recalculate unit costs monthly after recoating upgrades | Blame scrap on powder prices |
Common Errors in Interpreting 2023 Numbers
| Error | Why it Fails | How to Avoid |
|---|---|---|
| Treating 11% overall as a signal | Your segment might be -10% or +26% | Pull segment-level data from Wohlers, SmarTech |
| Chasing powder discounts | Powder accounts for only 3% of cost difference | Invest in nesting and powder recoating |
| Assuming hype-era forecasts are still valid | 2021 curves overestimated 2023 by 2x | Reset baseline with actual Q4 2023 values |
| Waiting for perfect certification | Competitors submit first, occupy specifications | Submit with current materials, then iterate |
| Buying three machines based on one forecast | Utilization below 45% kills ROI | Invest in stages backed by signed orders |
| Ignoring contract manufacturing consolidation | Prices will rise 8–12% by mid-2024 | Lock in multi-year contracts in Q4 2023 |
2023 AM Investment Decision Checklist
- Pull the actual 2023 growth rate for your specific end-use segment, not the overall industry average
- Confirm that signed orders cover over 55% of the planned production line's first-year capacity
- Identify four derivative part numbers that share the same certification package
- Lock in contract manufacturing or powder agreements at 2023 prices before Q1 2024
- Attribute unit cost reductions to 9% from nesting and powder recoating, not powder prices
- Plan workforce based on 2023–24 hiring to avoid operator scarcity
- Implement capital expenditure in two phases, with the second phase triggered by the first production line reaching over 60% utilization
- Any 2021 forecast must be re-baselined with actual Q4 2023 values before going to the board
Design Implications of 2023 Interpretation
2023 was the year the industry shifted from a "printer story" to a "parts story." Compounding growth teams are those that scale according to their segment, spread certification across derivative part numbers, and drive down unit costs through build density and yield—not powder discounts. Grasp these levers and plan production lines based on signed orders, and 2026 will be the year you record gross profit, not capital expenditures.


0 comments