
Supply chain resilience is the ability of a manufacturing network to absorb disruptions lasting two to twelve weeks, avoid production shutdowns, maintain customer commitments, and incur expediting costs no more than 8% above landed costs. This is a verifiable definition, not a slogan. A resilient network can list its top fifteen single-sourced parts, with at least two-thirds having qualified secondary sources, map its second-tier geographical distribution, and pre-qualify digital manufacturing buffers—making a stranded container ship just a bad week, not an entire lost quarter. The shocks of 2020–2023 forced this definition into budget sheets. Teams that treated resilience as a one-off audit will revert to single-sourcing when cost pressures return in 2024. Teams that integrated it into SOPs, BOMs, and supplier contracts will maintain their insurance coverage.
Failure Modes Resilience Must Absorb
Resilience investments only pay off when you know "which failure they are mitigating." Generic "diversification" plans scatter budgets on low-probability risks, leaving critical single-source parts exposed. The table below lists failure modes actually recorded by teams between 2020–2025, ranked by frequency and production disruption impact—use it to prioritize investments for the next 12 months.
| Failure Mode | 2020–25 Frequency | Outage Days | Typical Remediation Cost |
|---|---|---|---|
| Single-source semiconductor shortage | High | 30–120 days | Qualifying second source USD 400K–2M |
| Container rate spikes + delays | High | 10–40 days | Expediting fees USD 150K–600K |
| Tier 2 resin plant fire or force majeure | Medium | 15–60 days | Qualifying alternative USD 200K–800K |
| Regional geopolitical export controls | Medium | 45–180 days | Multi-regional CapEx, case-by-case |
| Flooding or earthquake at molding location | Low | 60–240 days | Mold replication USD 500K–3M |
| Labor action at a single port | Medium | 5–21 days | Rerouting costs 4–9% of COGS |
| Tier 1 supplier cybersecurity incident | Low—Medium | 7–30 days | Pre-qualified backup supplier |
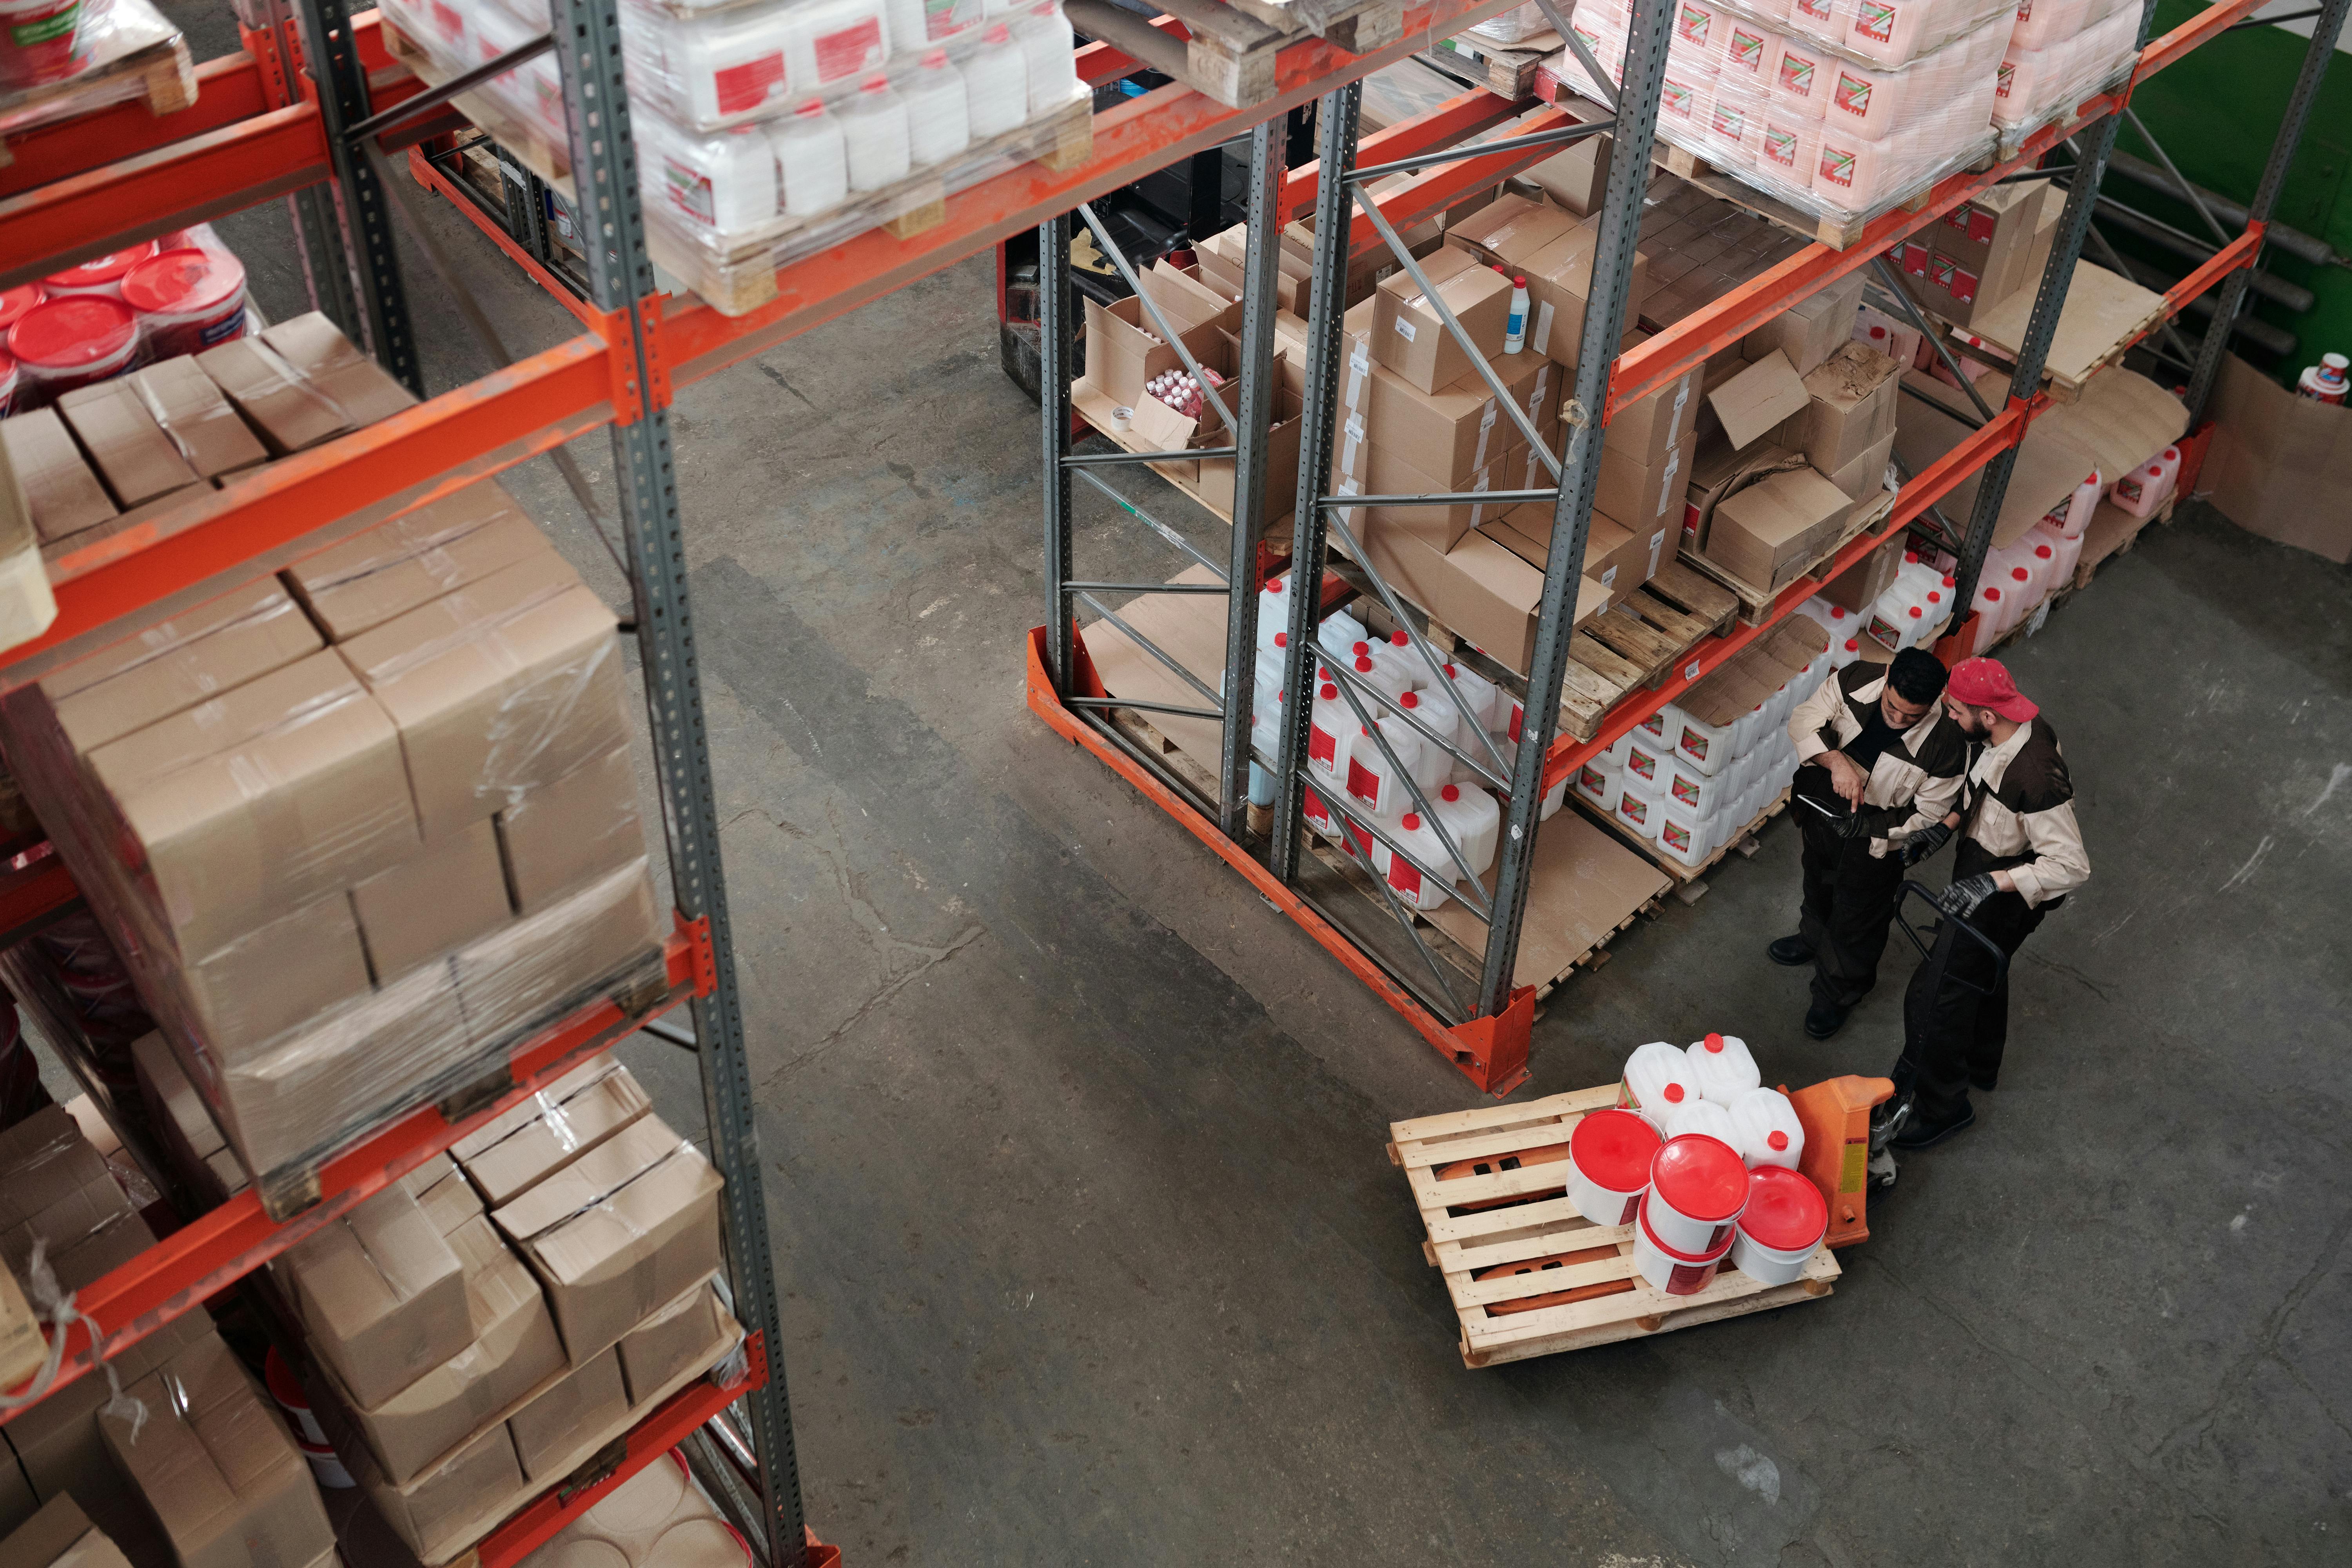
Multi-sourcing is the highest return action
Qualifying a second source costs between USD 120,000–600,000 per critical part, depending on complexity and regulatory scope. It is also the single highest-return action: manufacturers who had prepared a second source for their top 15 single-sourced parts in 2023 lost an average of 0.8 weeks of production during disruptions, compared to 6.2 weeks for peers without. The break-even point is reached at "any 30-day disruption with a 7–9% probability"—and since 2020, this probability has been over 15% annually. Buffer inventory is effective, provided it is placed at bottlenecks, not everywhere.

Regional redundancy vs. full reshoring
Full reshoring rarely crosses the cost-benefit threshold; regional redundancy—operating 20–40% of production in a second region near major demand—does in most combinations. The determination is made per SKU: if landed costs increase by more than 9%, and protected revenue is less than 3 times this difference, reshoring loses; if the product is strategic (medical, defense, critical grid) or tariff exposure exceeds 12%, redundancy wins.
| Layout Strategy | Applicable Scenario | Typical Cost Increase | Resilience Gain |
|---|---|---|---|
| Single global plant | Commodity SKUs, stable demand | Baseline | Low |
| Main plant + regional redundancy (20–40%) | Strategic SKUs, tariff exposure | 4–9% | High |
| Dual region 50/50 | Regulated products, high value | 8–14% | Very high |
| Full reshoring | Defense, medical critical | 15–30% | Very high |
| Digital manufacturing buffer only | Long-tail + spare parts | 1–3% | Medium |
Three Projects that Honestly Priced Resilience
Medical Device Manufacturer Qualifies Two Resin Sources, Avoiding 14-Week Outage
A Class II medical device manufacturer spent USD 380,000 in 2022 to qualify a second medical-grade PC resin, as their primary supplier hinted at capacity constraints. In February 2024, the primary supplier unexpectedly shut down for 14 weeks due to a raw material contamination incident. The backup source absorbed 100% of demand for 12 consecutive weeks, with no production line stoppage, requiring only a regulatory change notification revision. The total cost of this disruption was USD 110,000 in expediting and re-validation—compared to peers who retained a single source and lost USD 4.8 million in revenue. The cost structure is critical. The USD 380,000 upfront cost was spread across the product line at USD 0.04 per unit. At 9.5 million units annually, the USD 380,000 was recovered in the first year, even without a disruption. In this case, resilience was free. The real signal: resilience that spreads into unit costs below USD 0.05 and pays for itself within 12 months through volume is free; resilience that requires a separate "risk budget" line item rarely survives the next cost-cutting round. Make second-source qualification a unit cost item, not a capital expenditure event.
Consumer Electronics OEM Maps 340 Tier 2 Suppliers in 90 Days
A mid-sized consumer electronics OEM discovered in 2021 that 18 of its 42 Tier 1 suppliers relied on the same Tier 2 flexible PCB factory in the same city. A 12-day lockdown in that area halted production for 38% of the OEM's SKUs. In 2022, they used USD 160,000 for software and one full-time analyst to map 340 Tier 2 suppliers, identifying four other hidden concentration risks. By 2024, a second source was prepared for each hidden concentration. During the container rate spikes in 2024, production continuity remained above 97%.
Industrial Equipment Manufacturer Pre-Qualifies Digital Manufacturing Buffer
An industrial pump manufacturer pre-qualified three digital manufacturing suppliers (CNC, metal binder jetting, sheet metal) in 2023 to cover 62 long-tail spare parts, at a certification cost of USD 210,000. In late 2024, when a Tier 1 casting foundry was forced to shut down due to a regulatory audit, the pump manufacturer rerouted 48 SKUs to the digital buffer within 72 hours. The unit cost was 1.9 times the casting baseline, but the total premium of USD 290,000 corresponded to USD 6.3 million in protected customer commitments. Pre-qualified digital buffering turned a 14-week outage into a 3-day reroute.
Visibility into Tier 2 and Tier 3 is not optional
The problem with hidden concentrations is that your Tier 1 diversification might look good, but three of those suppliers could all be sourcing from the same Tier 2 resin or PCB factory. Mapping software (Resilinc, Everstream, Interos) costs USD 80,000–240,000 annually for mid-sized enterprises and pays for itself with just one avoided 10-day disruption. Teams that treat it as an ongoing program—reviewed quarterly, with new Tier 1 contracts requiring approval—will find hidden concentrations before incidents occur.
Where to Place Buffer Inventory
For critical, long-lead-time, single-source parts, lean is dead; however, "buffering everywhere" is still expensive and rarely helpful. The sustainable guideline for 2024–2026 is: buffer at the bottleneck, not at the entrance. For a part with a 16-week lead time and no second source, having 6–8 weeks of buffer at the assembly plant is better than 12 weeks at the supplier's warehouse, as it can withstand transportation disruptions. For parts with a second source, 2–3 weeks at the assembly end plus a qualified call-off contract is better than hoarding large quantities.
Design Actions that Make Resilience Cheaper
| Design Action | Unit Cost Impact | Resilience Benefit | Best Applied To |
|---|---|---|---|
| Standardize resin families across SKUs | 0 to +2% | Halve second source qualifications | Polymer housings, overmolded parts |
| At least two qualified suppliers per component | +2 to +4% | Eliminate hidden concentrations | Connectors, fasteners, ICs |
| Dual geometry design for casting or machining | +3 to +6% | Reroute without re-drawing | Housings, brackets |
| Consolidate fastener families | 0 to +1% | Reduce long-tail shortages | All assemblies |
| AM-ready spare part CAD files | 0 | Digital buffer activated in 72 hours | Long-tail, legacy SKUs |
| PCB layout supporting two EMS providers | +1 to +3% | Second EMS reroute | High-volume electronics |
Actual Cost of Qualifying a Second Source
Certification costs are primarily driven by regulatory scope, not engineering hours. A second source for common commercial fasteners typically costs USD 15,000–40,000 and can be completed in 6–10 weeks. A second source for medical-grade resins costs USD 300,000–600,000 and takes 30–52 weeks, due to change notifications, biocompatibility testing, and design history file updates in the pipeline. Budgeting should be based on category, not averages.
| Component Category | Certification Cost | Timeline | Regulatory Driven |
|---|---|---|---|
| General Fasteners | USD 15K–40K | 6–10 weeks | First article inspection sufficient |
| Industrial Resins | USD 60K–180K | 12–20 weeks | Spec alignment + QA audit |
| Electronic Components | USD 80K–220K | 10–18 weeks | AEC or JEDEC re-testing |
| Medical-grade Resins | USD 300K–600K | 30–52 weeks | ISO 10993, DHF updates |
| Aerospace Castings | USD 400K–1.2M | 40–80 weeks | Nadcap + PPAP |
| Semiconductor Chips | USD 800K–2M | 52–104 weeks | Full qualification + reliability |
Dos and Don'ts for Building Resilience
| Do | Don't |
|---|---|
| First qualify second sources for the top 15 single-source parts | Spread a thin budget across 200 SKUs |
| Redraw Tier 2 geography quarterly | Assume Tier 1 diversification is enough |
| Amortize certifications into unit costs | Put them into a "risk budget" that will be cut |
| Pre-qualify digital manufacturing buffers | Wait for a crisis to find digital suppliers |
| Place buffer inventory at the bottleneck | Place buffers in every warehouse |
| Standardize resin and fastener families across SKUs | Let each project pick its own specialty items |
Common Mistakes in Resilience Planning
| Mistake | Why it Fails | How to Avoid |
|---|---|---|
| Treating resilience as a one-off audit | Discarded when cost pressures return | Incorporate into SOPs, BOMs, quarterly reviews |
| Tier 1 diversification without Tier 2 mapping | Hidden concentrations will still halt you | Use mapping software, update quarterly |
| Reshoring everything | Cost increases 15–30%, disproportionate benefits | Determine per SKU, prioritize redundancy over reshoring |
| Placing buffers everywhere | Ties up capital, misplaced | Buffer only at bottlenecks |
| Vertical integration for resilience | You acquire the supplier's problems | Multi-source instead, retain options |
| Qualifying a second source but not using it | Specifications will quietly drift | Run 5–10% of volume through it quarterly |
2026 Checklist Before Signing Supplier Contracts
- List the top 15 single-source parts by disruption impact (not procurement spend)
- Confirm each has a named second source with completed first article approval
- Map the Tier 2 geography for the top 40 Tier 1 suppliers, identify any triple concentrations
- Amortize second-source certifications into unit costs, don't create a separate "risk budget"
- Confirm digital manufacturing buffers are pre-qualified for at least 40 long-tail SKUs
- Place buffer inventory at the assembly bottleneck, not at supplier warehouses
- Run 5–10% of volume through second sources quarterly to prevent spec drift
- Run a layout test per SKU before presenting any reshoring or redundancy proposals
2026 Design Insights for Resilience
Resilience is effective because it is specific, amortized, and continuously practiced. Specificity means knowing which 15 failures you are mitigating. Amortization means costs live within unit costs, surviving the next cost-cutting cycle. Practice means second sources, mapped Tier 2s, and digital buffers are warm enough to maintain qualification. Teams that do all three price a 14-week outage as a bad week; teams that do only one or two will still lose an entire quarter when the impact hits.


0 comments