
A defense MRO procurement replaced an old hydraulic bracket that cost $4,800 per unit, had an 18-week lead time, and a minimum order quantity of 25 pieces, with an SLS nylon printed part costing $186 per unit, delivered in 6 days, and with no minimum order quantity. The warehouse no longer stocks this part—the CAD file is the inventory.
Difference between Industrial Production and Prototyping Mindset
Prototyping procurement asks, "How much does one piece cost?" Industrial procurement asks, "What is my total cost for this part over its entire lifecycle—including molds, inventory, scrap, and expedites?" AM truly excels at the second question.
Once holding costs (typically 20–30% of inventory value annually), MOQ penalties, revision obsolescence, and expedited shipping are factored in, the unit price premium of AM often disappears. For short runs of under 500 units, AM frequently beats injection molding in total landed cost, even with a higher sticker price.
Leverage 1: Batching and Build Chamber Fill Economics
Powder bed processes (MJF, SLS, DLS stacking) charge for the build cycle, not per part. An empty build chamber and a full one take roughly the same machine time. Adding parts to an unfilled chamber has a near-zero marginal cost.
Key design action: Stack orders with the same material and layer height, then print when the fill density crosses 55–65%. Below this threshold, allocated overhead costs skyrocket; above 75%, thermal management and warping start to eat into yield.
| Process | 20 pcs sparse | 50 pcs stacked | 150 pcs bulk | Production Savings |
|---|---|---|---|---|
| MJF PA12 | $42 / pc | $21 / pc | $14 / pc | 67% |
| SLS PA11 | $58 / pc | $31 / pc | $22 / pc | 62% |
| DLS EPU 40 | $74 / pc | $41 / pc | $28 / pc | 62% |
| SLM 316L | $380 / pc | $245 / pc | $178 / pc | 53% |
Two scheduling habits can unlock most of the savings: (1) Consolidate cross-SKU releases into weekly build cycles, and (2) with NDA permission, allow service providers to combine your parts with other customers' parts in the same build. Neither requires design changes—only procurement discipline.
Leverage 2: ROI of Part Consolidation
Every part in an assembly carries hidden costs: a BOM line item, a procurement process, an incoming inspection, a shelf slot, a screw, a minute of labor. Consolidating eight parts into one printed piece saves not just material, but the entire assembly supply chain.
| Assembly | Parts before integration | Printed replacement | Unit price before integration | Unit price after integration | Net Savings |
|---|---|---|---|---|---|
| Drone ESC Bracket | 5 pcs + 8 screws | 1 pc MJF PA12 cage | $38 | $22 | 42% |
| Robot End-Effector | 12 pcs + 6 screws | 1 pc SLS PA11 monolithic part | $214 | $138 | 36% |
| Hydraulic Manifold | 8 pcs + welded joints | 1 pc SLM 316L monolithic block | $1,850 | $980 | 47% |
| Medical Device Housing | 6 pcs + adhesive | 1 pc DLS EPU housing | $92 | $61 | 34% |
Leverage 3: Digital Inventory and On-Demand Spares
Physical inventory costs money even when it's not moving. For an industrial buyer stocking $2 million in obsolete spares, a 25% carrying rate burns $500,000 annually, for parts that might never leave the shelf.
Digital inventory models also eliminate MOQ penalties. Casting and injection molding suppliers typically require minimum orders of 250–1,000 units; AM service providers can produce single units. For low-volume SKUs—which make up 40–60% of the long tail of a spare parts catalog—this is a qualitative change.
| Cost Category | Traditional Spare Parts Stockpiling | AM Digital Inventory |
|---|---|---|
| Upfront Procurement | $2 million (MOQ-driven) | 0 |
| Annual Holding Costs (25%) | $500,000 | 0 |
| Year 5 Write-Offs | $300,000–$600,000 (common) | 0 |
| Expedited Shipping | $80,000–$150,000 annually | $20,000–$40,000 annually |
| Unit Price | Avg. $45 (bulk) | Avg. $120–$240 (on-demand) |
| Total 5-Year Holding Cost | $4.5 million–$5.2 million | $1.1 million–$1.8 million |
Leverage 4: Distributed Manufacturing and Supply Chain De-risking
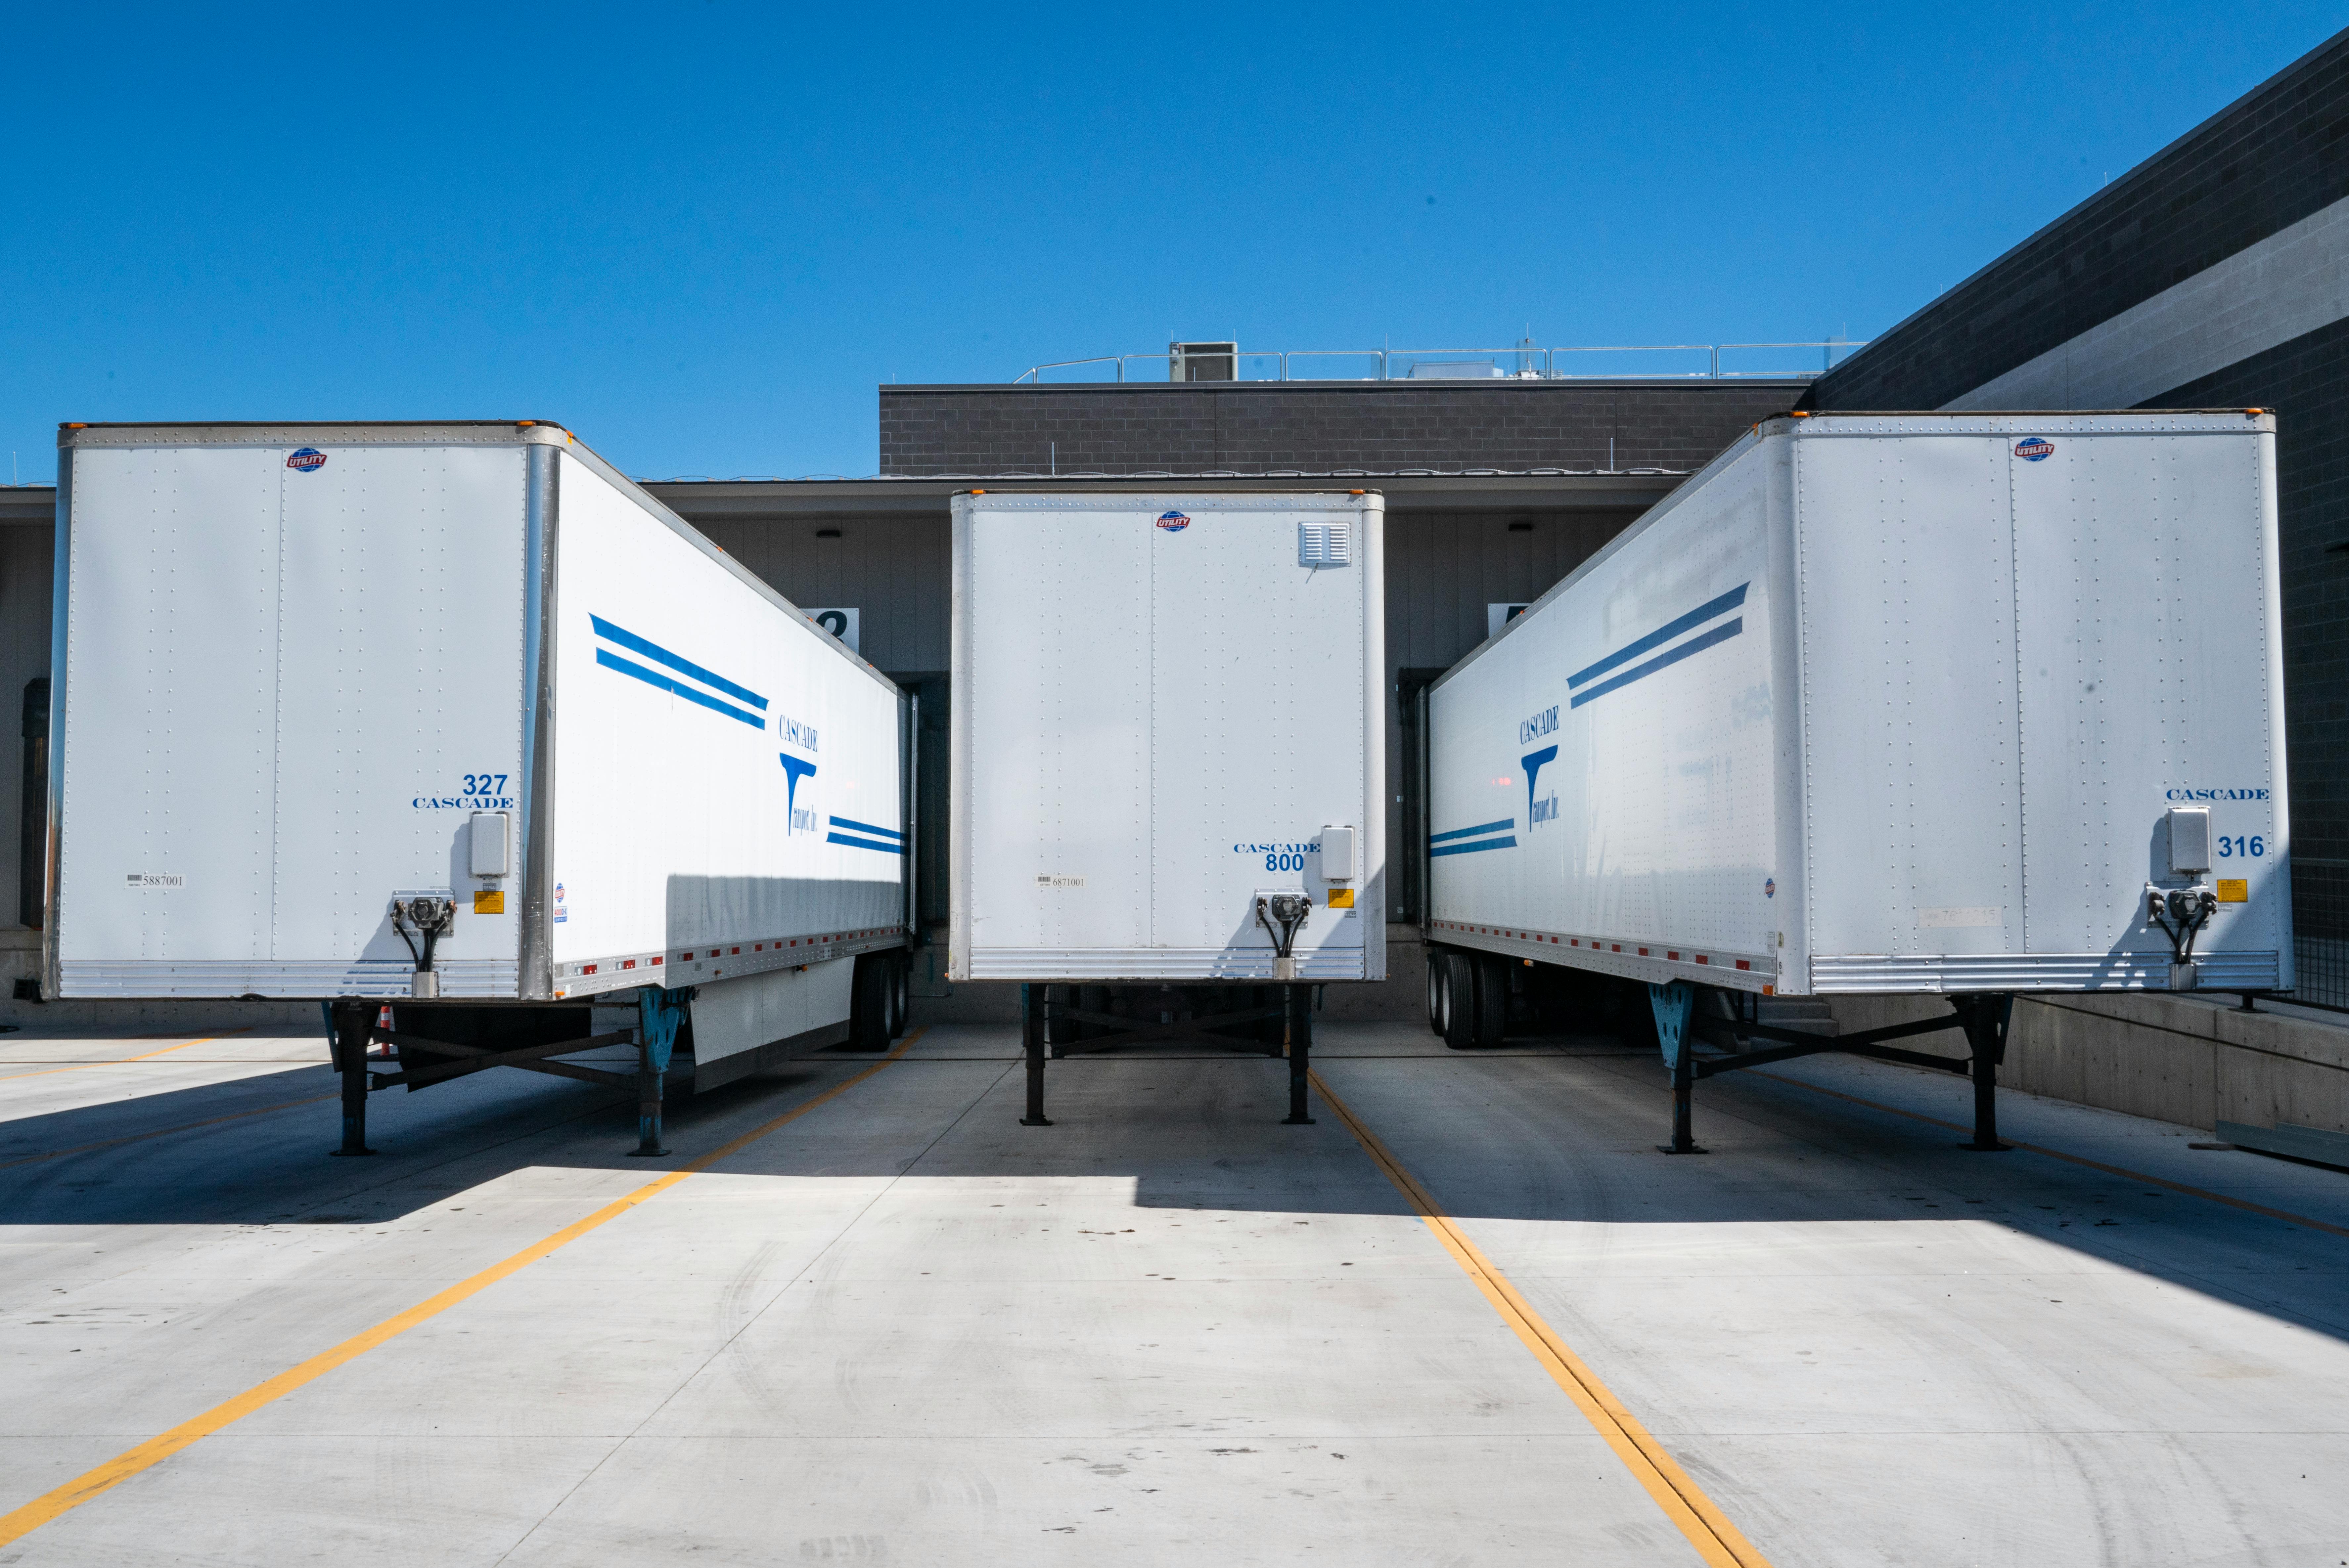
Print locally. An STL file can be sent to a service provider in Taipei, Munich, or Austin—whichever is closest to the point of failure. This eliminates 4–12 weeks of sea freight and slashes expedited shipping costs that previously dominated MRO budgets.
Distributed AM also mitigates single-source risk. If a supplier has issues or a natural disaster strikes, the same file can be sent to another certified printing facility within 48 hours. For critical parts, multi-factory certification isn't a luxury; it's supply chain risk management.
Leverage 5: Portfolio-Wide DfAM Stacking

Redesigning a single part saves a little. Applying DfAM rules to a portfolio of 400 SKUs can save millions. The rules are tedious but accumulate: standardize wall thickness to reduce material consumption, orient parts to minimize supports, and use only one primary material per process family—compressing setup costs and scheduling complexity.
Applications: Three Portfolio Cost Reduction Cases
Aerospace MRO Obsolete Spares (Large OEM, 2,400 SKUs)
An aerospace MRO team audited 2,400 SKUs in its obsolete catalog, with 38% of SKUs moving less than 4 units annually. The stock value was $14.2 million, with a 28% carrying rate. They transitioned to an AM digital inventory, recertifying print parameters for 912 SKUs and signing digital inventory agreements with two AS9100-certified service providers.
Results after 14 months: $6.1 million in inventory disposed, annual holding costs reduced by $1.7 million, and average spare parts lead time dropped from 11 weeks to 9 days. While the average print unit price was 2.3 times the old bulk price, once holding and expedited costs were factored in, the five-year TCO decreased by 48%.
Industrial Equipment Replacement Parts Delivered as Files (Packaging Line OEM)
A European packaging line OEM supports 1,100 machines in service worldwide, many 10–20 years old. Previously, a broken guide rail meant a 3-week air freight from the Milan warehouse. The new model: 46 regional AM partners stock no parts, only signed file packages.
Average downtime per incident dropped from 17 days to 3.5 days. Annual spare parts logistics expenditure decreased from $3.8 million to $1.4 million. Crucially, the OEM no longer pays storage fees for machines that may never be repaired again—the obsolescence risk has shifted to digital inventory.
ESC Bracket Integration (Industrial Drone Platform)
A commercial drone manufacturer shipped quadcopter frames where each ESC (electronic speed controller) sat on a stamped aluminum plate, bolted to a CNC strut, with a silicone anti-vibration pad, screws, and a laser-etched label—5 parts per motor, 4 motors per drone.
Integrated into a single-piece MJF PA12 cage, incorporating a lattice vibration damping structure, snap-fits for the ESC PCB, and embossed part numbers, the cost per drone dropped from $152 to $88, and assembly time from 22 minutes to 4 minutes. With 18,000 units produced annually, total savings including labor reached $1.15 million.
Do's and Don'ts
| Do | Don't |
|---|---|
| Stack cross-SKU builds weekly to achieve over 60% fill rate | Print single parts with 20% fill and complain about high unit prices |
| Score integration candidates by assembly labor hours, not just part count | Integrate for integration's sake, turning assemblies into unserviceable monolithic blocks |
| Prioritize digitizing long-tail spare parts | Digitize high-volume parts where casting still has an advantage |
| Certify 2+ regional print partners for critical files | Single-source digital parts like old single-source castings |
| Standardize one primary material per process family | Stock 5 types of nylon, each requiring independent build scheduling |
Common Mistakes
| Mistake | Why it's costly | Correction |
|---|---|---|
| Directly comparing AM unit price to injection molding | Ignoring lifecycle molds, MOQs, and inventory | Use total landed cost over SKU lifecycle |
| Using AM for prototyping in a production organization | Build chamber never full, high unit price | Consolidate builds weekly across SKUs |
| Integrating parts across service areas | One monolithic part breaks = 10 weeks for replacement | Retain serviceable segmentation for field machines |
| Skipping digital inventory governance | File drift, increased recalls | For each partner: signed STL + version history |
| Excluding post-processing from savings calculations | Dyeing, CNC, inspection add 20–40% | Quote printing and finishing separately |
Pre-Build Cost Checklist
- Aim for over 60% build chamber fill rate before printing; if not met, hold and wait for the next stacked build.
- Only integrate parts if assembly labor costs exceed $5 and integration does not hinder maintenance or disassembly.
- Document MOQ and lifecycle volumes—confirm AM can beat MIM/casting at that volume.
- Create digital inventory entries: signed STL, material specifications, process parameters, inspection plan.
- For any file with an annual downtime cost impact greater than $50K, recertify at least one backup regional print partner.
- Quote printing costs and post-processing costs separately—do not allow hidden 30% finishing surcharges.
- Quantify the holding cost of replaced inventory to ensure savings arguments stand up to financial scrutiny.
Design Takeaways
Industrial-grade AM cost reductions occur at the portfolio level, not the individual part level. Batch stacking, integration, digital inventory, distributed printing, and portfolio-wide DfAM stack on top of each other—picking just one will result in a pilot project; doing all five can change your cost structure.
Start with the long tail: those slow-moving SKUs you stack in the warehouse, fret over, and eventually write off. That's where AM conversion is fastest and best teaches the organization to think in terms of files, not boxes.


0 comments