
Manufacturing innovation in 2026 is no longer a question of "whether to adopt digital tools"—that debate is over. The real question is: what two or three actions can product teams commit to this fiscal year without stalling their roadmap? Moving some SKUs to regional production, closing the loop on generative CAD and manufacturability quotes, incorporating recycled content percentages into BOMs, extending the digital thread from CAD to MES—these are now items that win or lose contracts, not just presentation slides. Below is an interpretation of signals from actual market pricing—adoption rates, deployment timelines, and the dollar amounts behind press releases—to help you decide where to place your bets for 2026.
Where the 2026 Innovation Budget is Really Going
Global smart manufacturing spending will exceed USD 400 billion in 2025 and is projected to approach USD 620 billion by 2028, with a compound annual growth rate just under 16%. However, the total obscures the shape of the investment: approximately 42% of new spending is flowing into software and integration, rather than new machinery. The teams truly gaining market share are those that treat the factory floor as a data surface first, and a cutting surface second.
| Segment | 2025 Market Size (USD 100M) | 2028 Estimate (USD 100M) | CAGR | Tier-1 OEM Adoption Rate |
|---|---|---|---|---|
| Industrial IoT & MES | 1,180 | 1,880 | 17% | 68% |
| AI/ML Process Control | 460 | 980 | 29% | 41% |
| End-Use Additive Manufacturing | 220 | 440 | 26% | 34% |
| Digital Twin & Simulation | 380 | 720 | 24% | 52% |
| Robotics & Cobots | 820 | 1,280 | 16% | 61% |
| Sustainability Reporting Technology | 140 | 310 | 30% | 47% |

Reshoring Is Selective, Not Universal
Over the past 24 months, approximately one in three North American and European manufacturers have genuinely reshored a portion of their critical production. However, the median relocation is narrow—15–25% of SKUs by unit count, not by revenue. What's truly coming back are parts where lead times, IP exposure, or regulatory traceability dominate the unit cost discussion. High-volume, low-margin commodity items remain offshore; the math hasn't changed there. The real move is to use regional capacity as a buffer, not a complete replacement. Effective projects maintain a primary distant supplier alongside a qualified regional secondary supplier, with the latter consistently handling 10–20% of the volume. Paying a 15% cost premium on this small portion is far cheaper than the USD 2–4 million revenue gap torn open by a six-week disruption.
| SKU Category | Typical Reshoring Decision | Cost Difference vs. Offshore | Lead Time Reduction |
|---|---|---|---|
| Commodity Fasteners/Stampings | Remain Offshore | — | — |
| Regulated Medical Subassemblies | Reshore as Primary | +12 to +18% | 6–10 weeks |
| Defense/Aerospace Machined Parts | Reshore as Primary | +20 to +35% | 8–14 weeks |
| Consumer Electronics Housings | Dual-source Strategy | Regional +8 to +14% | 3–5 weeks |
| Industrial Spare Parts (Low Volume) | Regional On-Demand Printing | Flat to +10% | 4–8 weeks |
| Automotive Body Panels | Remain/Regional Secondary | +15 to +22% | 2–4 weeks |
AI-Assisted Design Finally Closes the Loop
Generative design has been on the hype cycle for a decade. The real change in 2025 is integration: leading tools now return cost estimates, process recommendations, and manufacturability flags alongside every geometric suggestion, rather than just a minimized mass number. This single action transforms generative design from a showcase into a tool that mechanical engineers will actually open on a Tuesday morning. On the process control side, narrow AI will win. Deploying visual inspection for a single, well-defined defect category can achieve ROI within 4–7 months; full-factory AI scheduling largely remains on the whiteboard. Teams that select a well-sensored unit, close that loop, and then expand will continue to accumulate gains; teams that buy a platform and then look for problems will mostly stall.
Signals from the Field
A Tier-1 Automotive Supplier Integrates 11 Brackets into 1
A European bracket assembly, originally shipped as 11 stamped and welded pieces, was replaced with a single topology-optimized aluminum die-cast part driven by generative design. Tooling amortization was heavier—USD 180,000 versus USD 72,000—but assembly time dropped from 94 seconds to 11 seconds, and weight was reduced by 28%. On a project producing 420,000 units annually, the payback period was 14 months. The truly significant signal is that the economics of generative design win not when it shaves 5% off unit weight, but when it allows you to delete downstream fasteners, welds, and fixtures. This supplier reduced the BOM line count for this assembly from 17 to 4.
A Medical Device Company Qualifies a Regional Secondary Supplier in 11 Weeks
An ISO 13485 handheld surgical device was originally supplied by a single Southeast Asian injection molding plant. A typhoon disruption caused USD 2.8 million in lost hospital deliveries. The team used a regional CNC and rapid injection molding partner to qualify a secondary supplier handling 15% of the volume within 11 weeks, accepting a 14% unit cost premium for that portion. The "insurance premium" paid for itself when a port strike impacted the primary supplier the following quarter.
A Consumer Brand Ships Recycled Content Packaging in Six Months
A direct-to-consumer appliance brand needed to achieve a 30% post-consumer recycled content ratio in its clamshell packaging to meet a major retailer's 2026 sustainability threshold. This project took 10 weeks for material trials (three PCR grades, two compatibilizers), 8 weeks for mold fine-tuning, and 6 weeks for production line validation. The scrap rate stabilized at 4.2%—1.8 percentage points higher than virgin material—but the retail contract was worth USD 9 million annually.
Sustainability Moves from Annual Reports to Procurement Specifications
In 2025, 47% of Tier-1 OEMs required documented CO2, recycled content, or circular economy plans in their supplier qualification processes—up from only 19% in 2022. This is projected to exceed 60% in 2026. The consequence for design is that PCR grades, bio-based resins, and features for disassembly are now being evaluated at the concept review stage, rather than being forced in 8 weeks before production.
| Design Lever | Typical CO2 Reduction | Cost Impact | Implementation Timeline |
|---|---|---|---|
| 30% PCR Resin Substitution | 18–24% | +3 to +8% | 3–5 months |
| Integrate Parts with Die Casting | 12–20% | Flat (tooling up, assembly down) | 6–9 months |
| Lightweight with Topology Optimization | 8–15% | Flat to +4% | 2–4 months |
| Design for Disassembly | 10–14% Lifecycle | +1 to +3% | 1–3 months |
| Switch Aluminum to Recycled Grade | 30–55% | +2 to +6% | 1–2 months |
| Source Resin Locally | 5–9% Logistics | Flat | 2–4 months |
Additive Manufacturing Finally Secures Its Place in Production
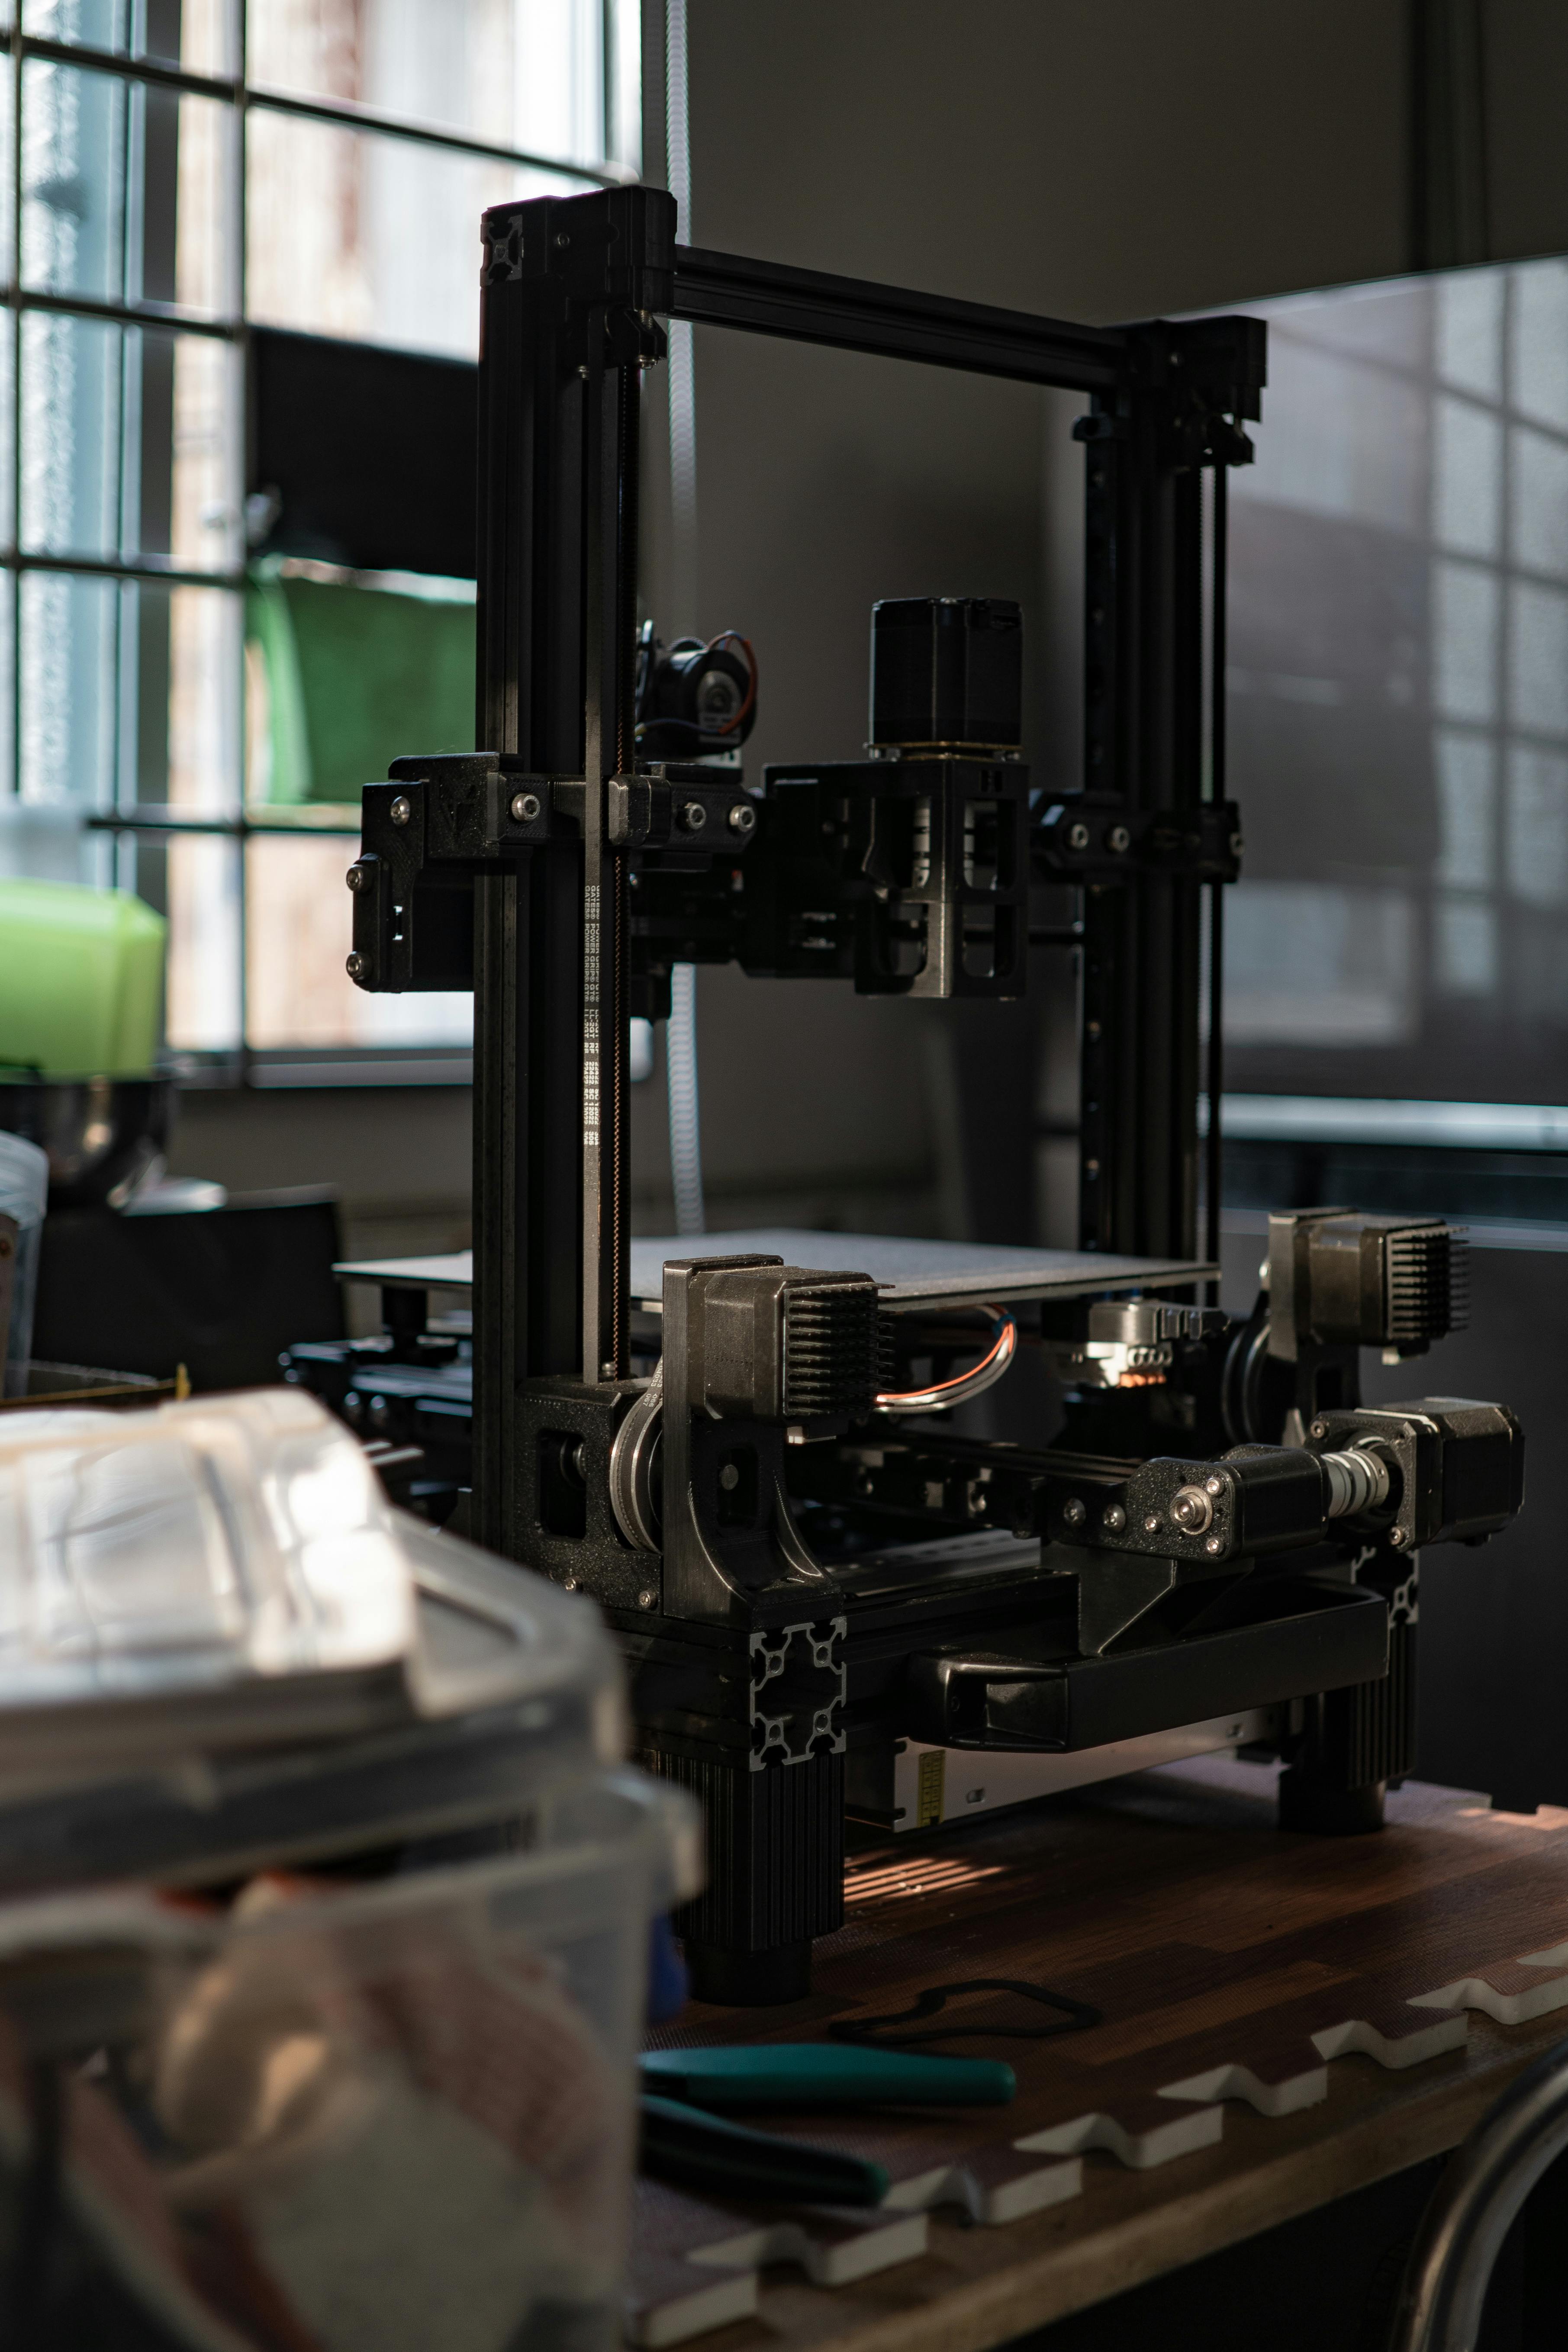
End-use additive parts exceeded 34% of Tier-1 OEM projects in 2025, with the strongest growth in medical (68% adoption), aerospace (51%), and low-volume industrial (47%). In mass-market consumer electronics, the share remains below 9%—beyond approximately 8,000 units, unit economics still favor injection molding unless internal geometries dictate otherwise. The discipline that differentiates winners is knowing which parts are additive candidates and which are not.
The Digital Thread Moves from Presentation to Real Toolchain
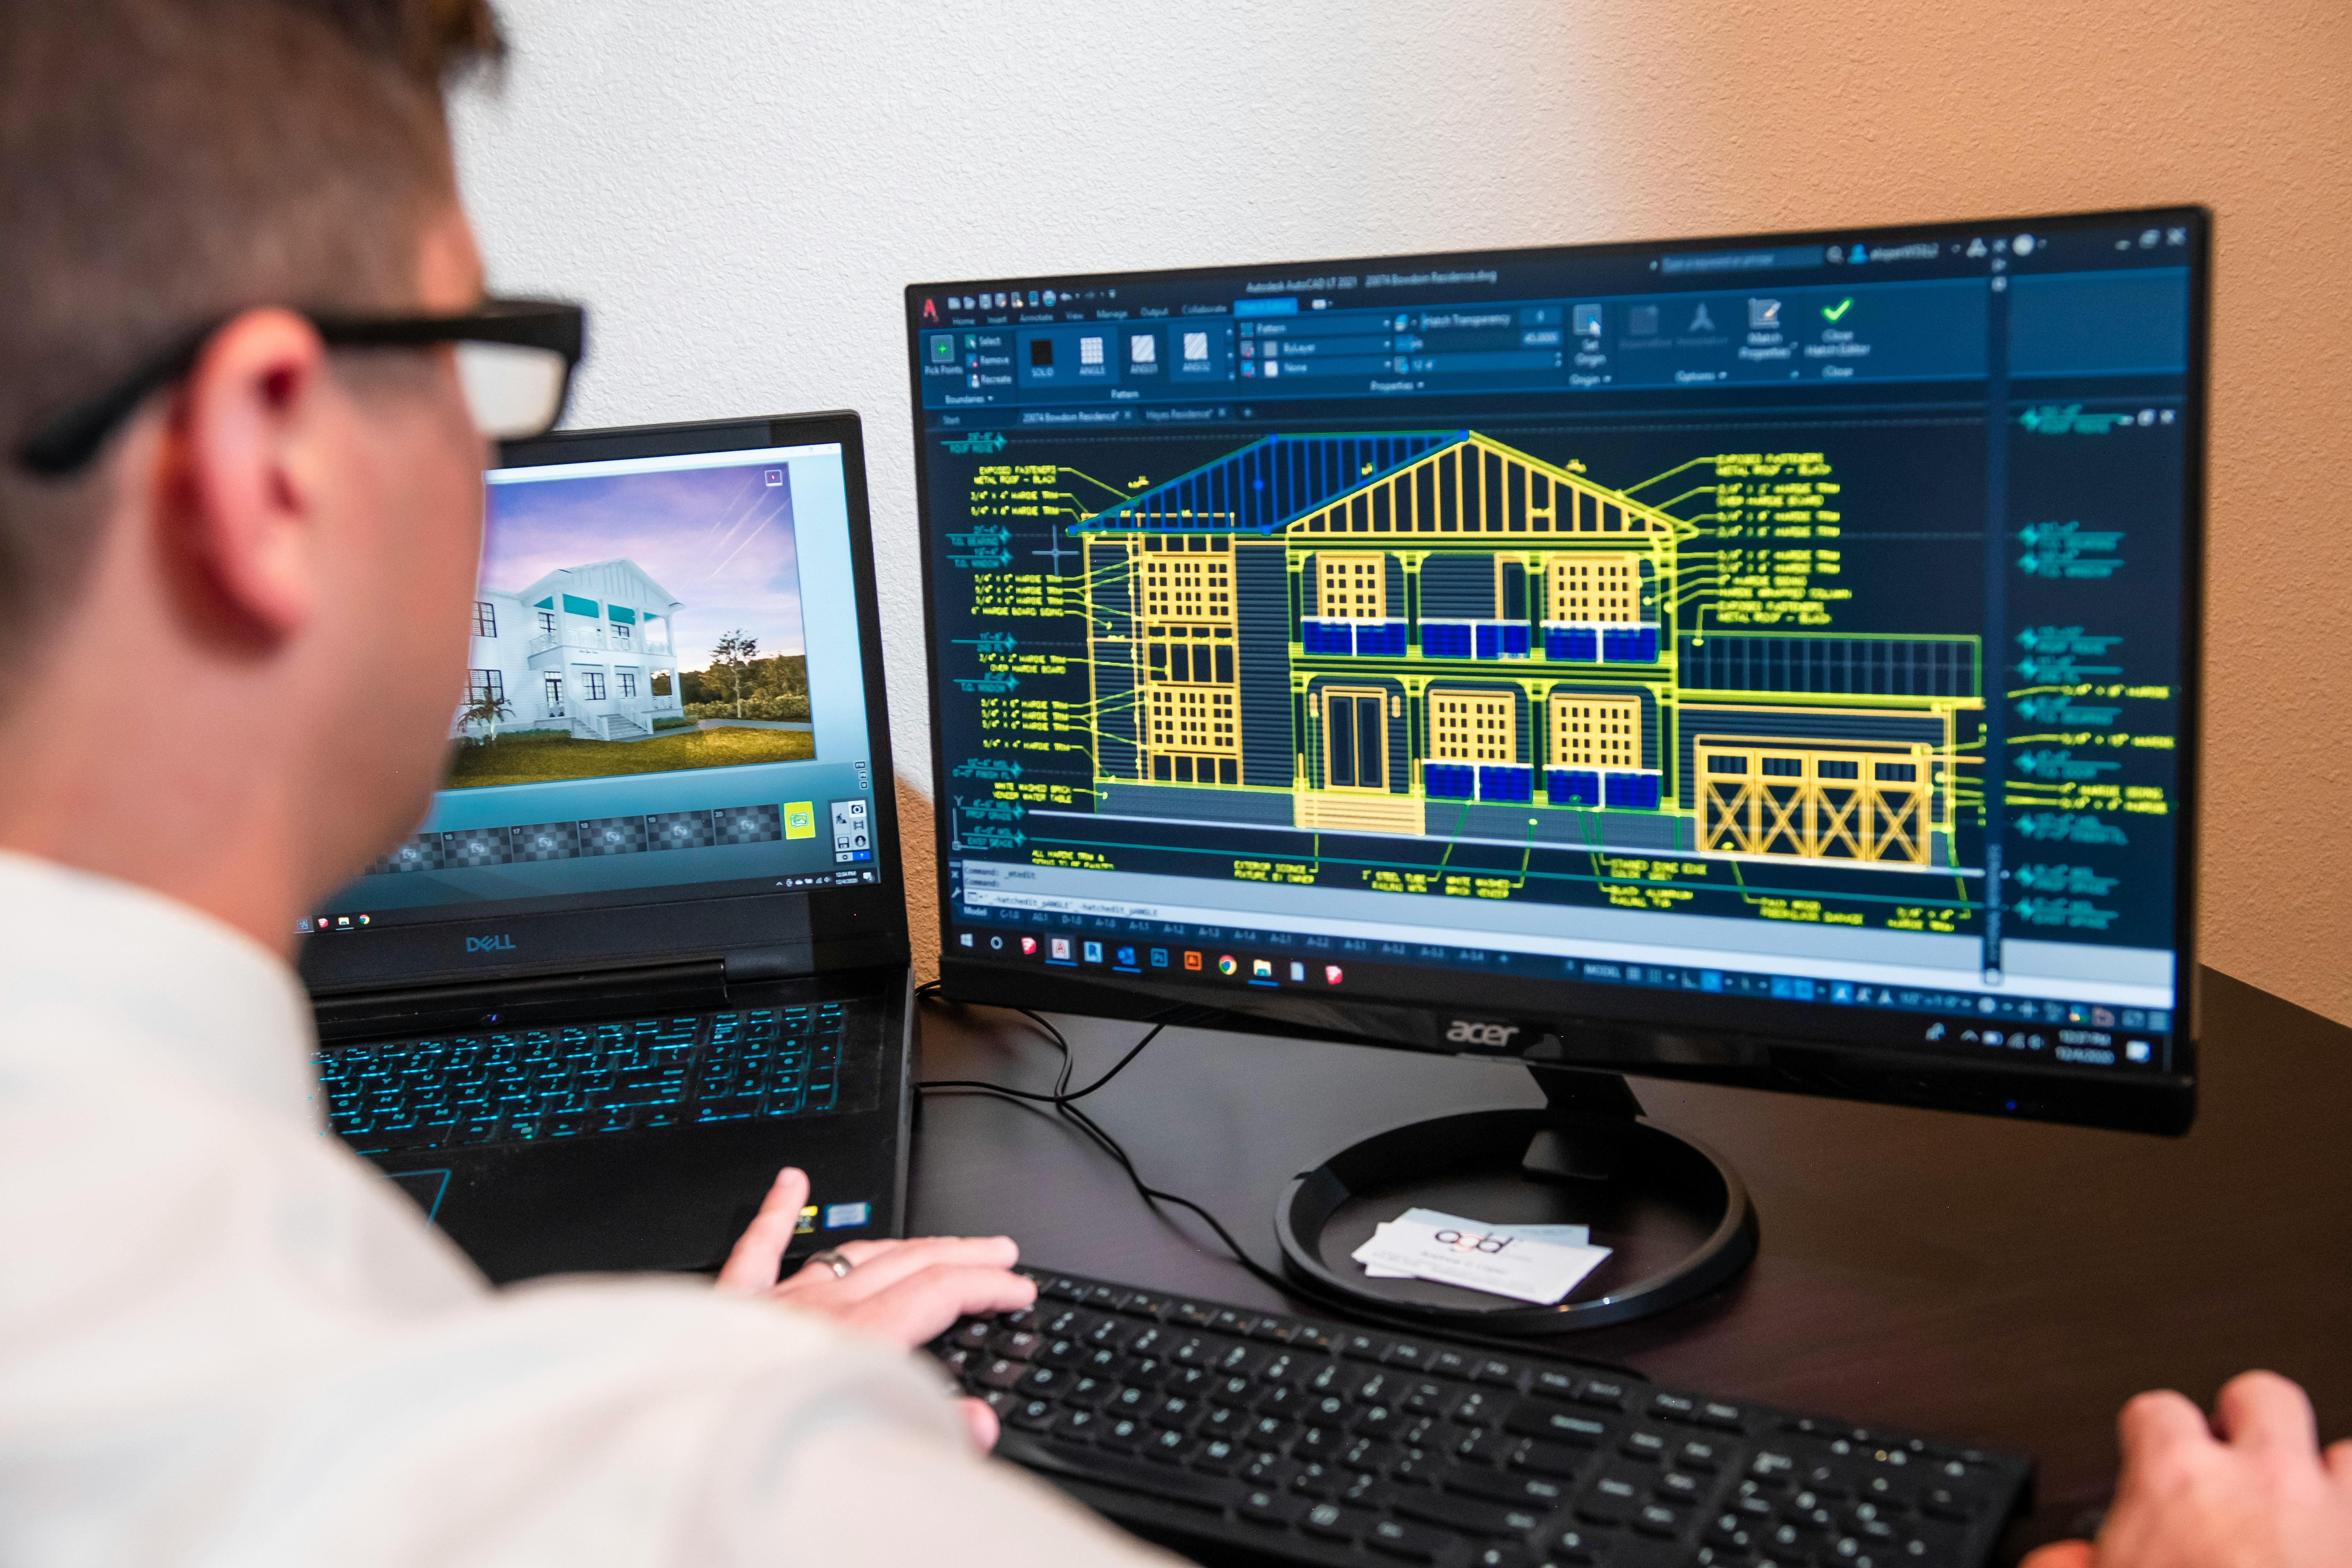
Five years ago, "digital thread" was a marketing term. In 2026, it's a measurable capability: 52% of Tier-1 OEMs report having established CAD-to-MES traceability for at least one product line; among these, the average engineering change order (ECO) cycle time decreased from 23 days to 9 days. Companies without a digital thread infrastructure are now demonstrably falling behind in warranty response and audit readiness, no longer just facing abstract efficiency claims.
A Two-Year Roadmap a Product Team Can Actually Digest
Most teams that try to tackle all topics in one fiscal year get stuck. Teams that consistently make progress choose two or three levers with clear ROI and advance them sequentially over 18–24 months.
| Timeline | Action | Typical Investment | Expected Return |
|---|---|---|---|
| 0–6 months | Qualify a regional secondary supplier for 10–20% volume | USD 40k–120k | Interruption insurance |
| 0–6 months | Deploy visual AI in one production cell | USD 60k–150k | 4–7 month payback |
| 6–12 months | Close the CAD-to-quote loop with DFM | USD 20k–80k (software) | 2–3x iteration speed |
| 6–12 months | Switch 1–2 components to PCR resin | USD 80k–200k | Meet retailer thresholds |
| 12–18 months | First end-use additive part | USD 150k–400k | Unit economics determined per part |
| 12–24 months | CAD-to-MES thread for one production line | USD 300k–900k | 50–60% ECO cycle reduction |
| 18–24 months | Generative design on one main component | USD 100k–250k | Delete 5–15 BOM lines |
The Labor Gap is in the Middle, Not at the Top
A 2026 mechanical engineering graduate is more likely to know Python and a CAD suite than how to operate a lathe. The sharpest labor gap exists one level above entry-level: operators who can run standalone machines but aren't yet proficient with sensored and analytical production cells. Investing in training at this level yields returns faster than hiring new graduates or retraining senior staff; the ROI window is 6–10 months.

Do's and Don'ts When Investing Your 2026 Innovation Budget
| Do | Don't |
|---|---|
| Pick 2–3 themes, commit to them | Spread thinly across six themes |
| Qualify a regional secondary source for 10–20% volume | Jump to full reshoring at once |
| Close the visual AI loop on one defect category first | Buy a factory-wide AI platform on day one |
| Incorporate PCR percentage into concept reviews | Force PCR in 8 weeks before production |
| Use ECO cycle time as digital thread KPI | Use "number of dashboards created" as KPI |
| Train mid-level operators to manage sensored lines | Assume new graduates can fill shop floor gaps |
Common Mistakes Teams Make in 2026 Planning
| Mistake | Why it Fails | How to Avoid |
|---|---|---|
| Choosing themes based on hype, not ROI | Budget burns out before adoption | Prioritize by 12-month ROI before starting |
| Treating reshoring as all-or-nothing | Cost impact kills the project | Dual-source, regional takes 10–20% |
| Buying an AI platform before identifying defects | No sufficiently narrow problem to solve | Pick one defect, one cell, one model |
| PCR resin as a last-minute substitution | Scrap rates and warping suddenly appear | Design it in at concept stage, not pre-production |
| Digital thread without ECO KPI | Lots of dashboards, no change in cycle time | Measure ECO cycle from day one |
| Skipping operator training | New lines sit idle | Allocate 8–12% of CAPEX for mid-level training |
Eight Strategic Actions for This Year
- Prioritize your six innovation themes by 12-month ROI and invest only in the top three.
- Qualify a regional secondary supplier to handle 10–20% of your volume by Q3.
- Select one production cell, one defect category, and one visual AI deployment; close the loop there before expanding.
- Incorporate a 30% PCR target into every new concept review this year.
- Extend the digital thread from CAD to MES on one production line, using ECO cycle time as the headline KPI.
- Run one main component through generative design, using BOM line reduction as the success metric, not weight.
- Allocate 8–12% of CAPEX for training mid-level operators to manage sensored production lines.
- Reserve a round of aluminum transitional molds for new SKUs before committing to hard tooling.
The Design Takeaway
The innovation story for 2026 is not a revolution; it's a set of items backed by real ROI calculations. Teams that pick two or three themes, advance them sequentially over 18–24 months, and measure the right KPIs for each will accumulate a lead quarter by quarter. Teams that chase every theme, or wait for the picture to become clearer, will fall behind in cost, lead time, and audit readiness at the pace their competitors advance.
0 comments